Make Your Move: From Parked Cash to Productive Income

Key Points:
- With Fed rate cuts now underway, future returns on cash are likely to decline.
- Short and intermediate bond funds offer higher yield-to-worst (YTW) potential.
- Powell’s reminder that policy is “far from predetermined” reinforces the need for real yield awareness and portfolio flexibility.
In today's fixed income market, investors are back at the game board. The dice have been rolled, and the Federal Reserve's first rate cuts mark a clear turn in this monetary cycle. For much of the past two years, “parking” cash felt like a winning move—collecting high yields while others navigated rate volatility. But with Powell emphasizing that policy is “far from predetermined,” the next few turns may be less linear than expected.
Just as in Monopoly, the spaces that once felt like “Free Parking” no longer provide easy rewards. As cash yields slip, the challenge is finding productive income opportunities without landing on the wrong square.
Free Parking? Not Anymore.
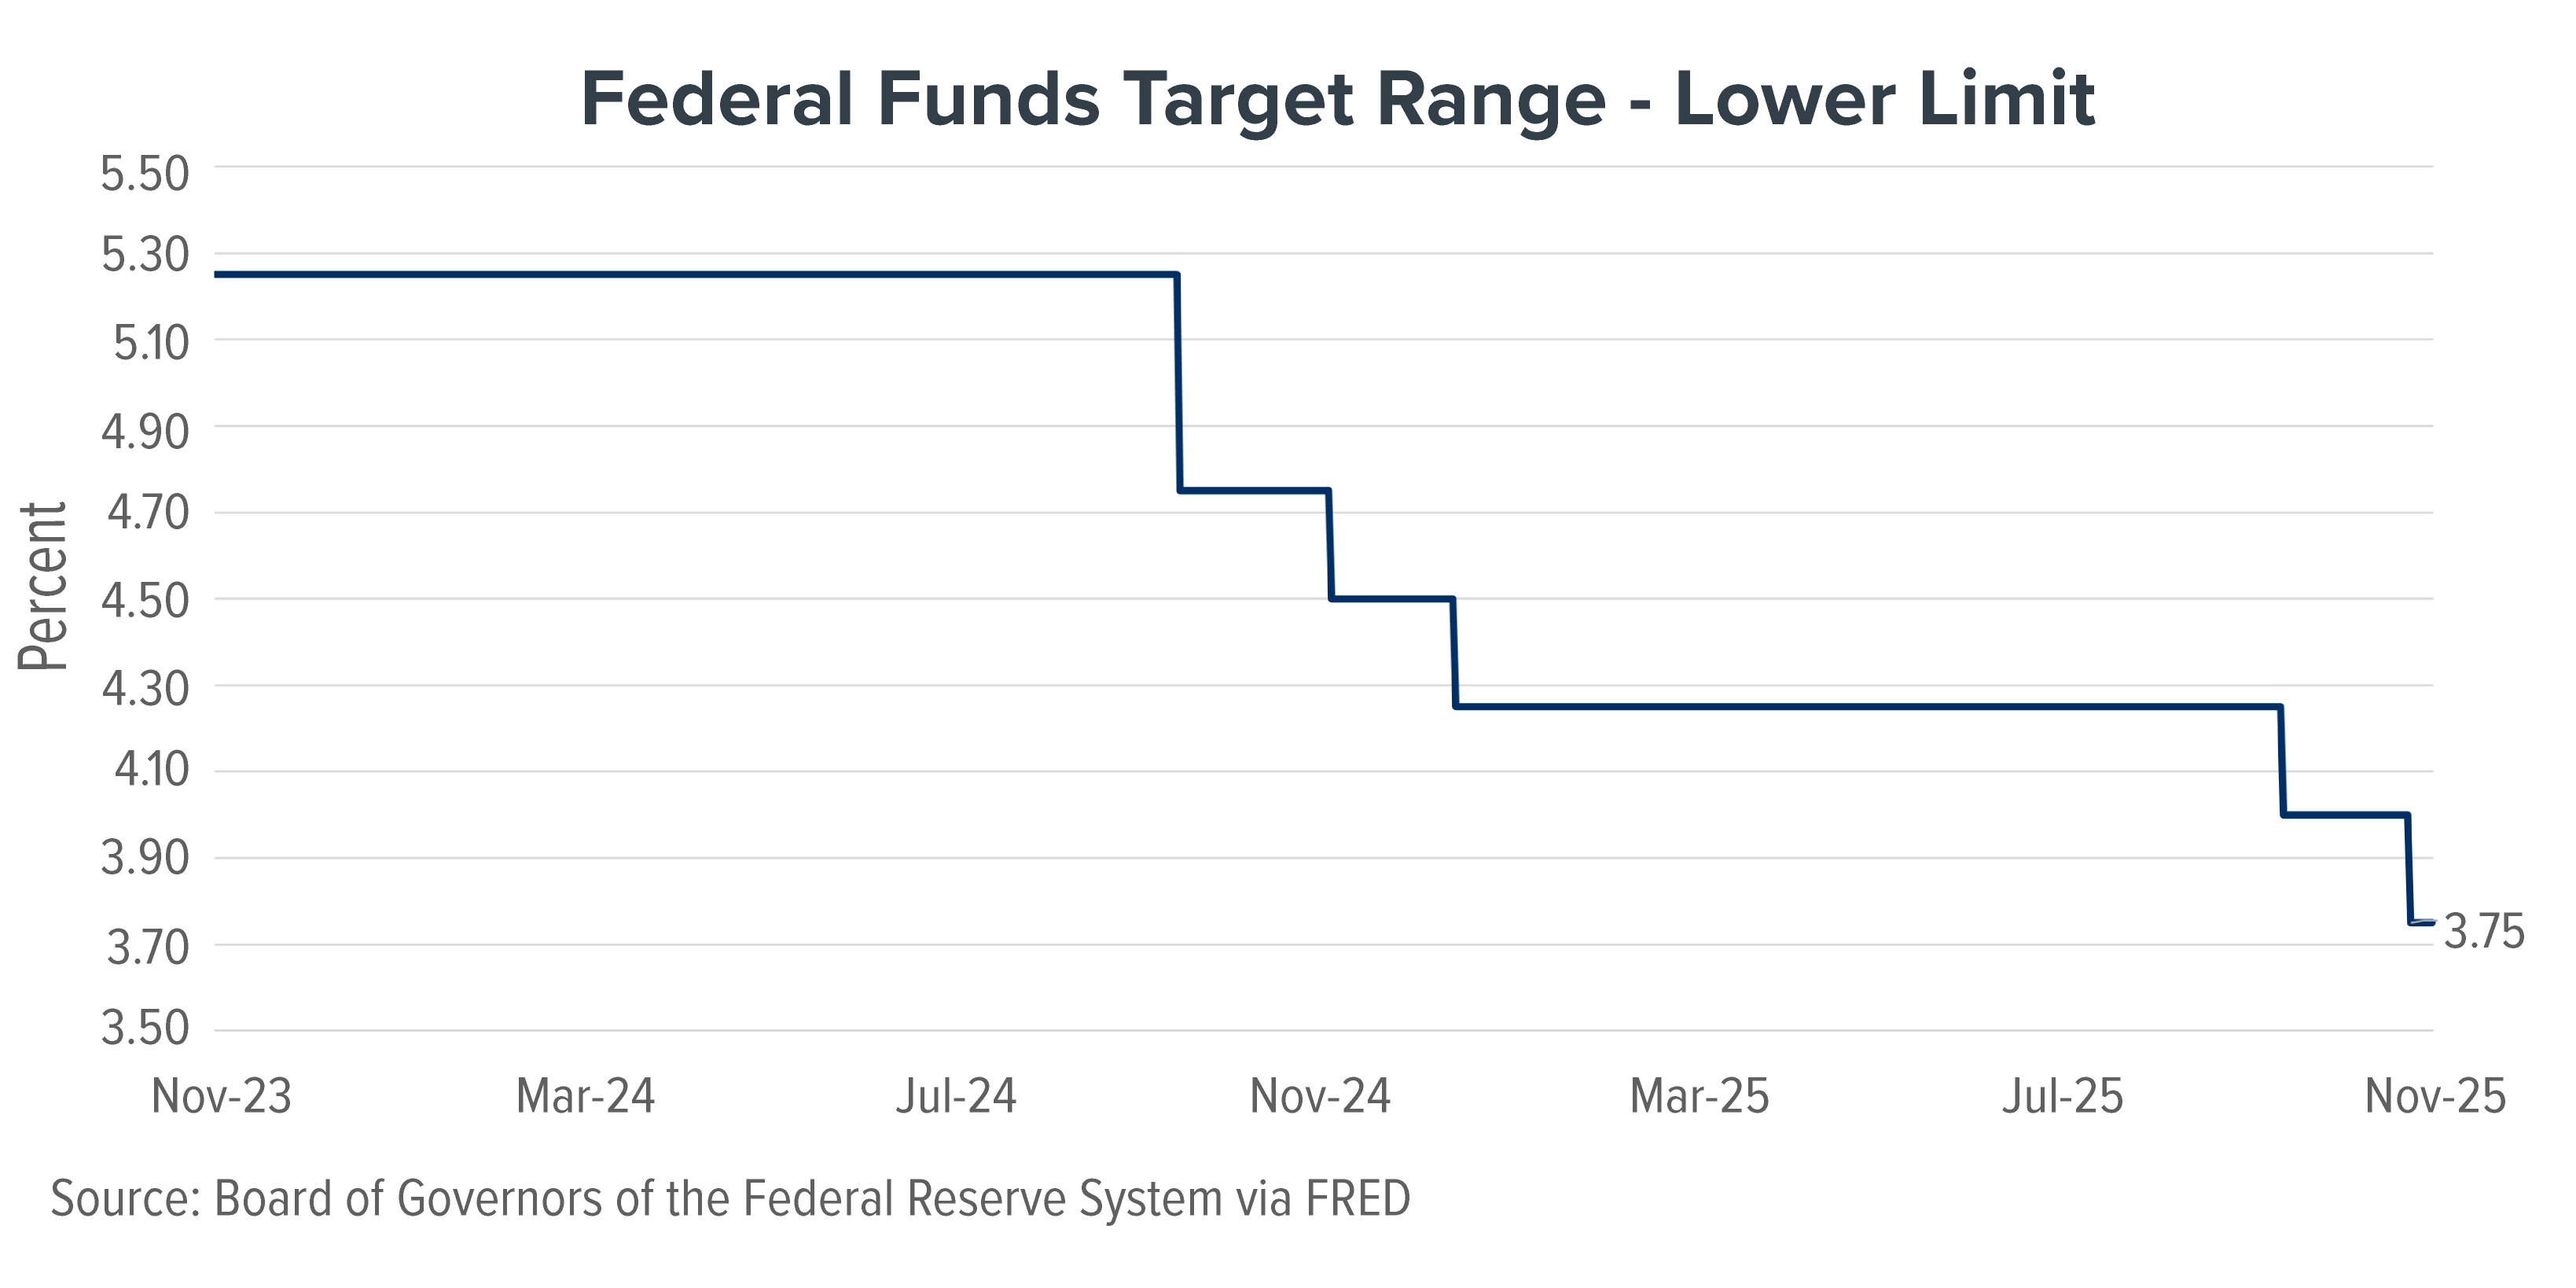
The Federal Reserve's first two rate cuts of this cycle have set a new tone for markets, even as Chair Powell emphasized that the path forward remains data-dependent. While the easing trend through 2026 is still the base case, recent comments highlight that monetary policy decisions will hinge on incoming inflation and labor data—not a preset trajectory.
This nuance matters. The initial rate cuts have already pushed front-end yields lower, narrowing the once-attractive gap between cash returns and inflation. For investors, that means the era of effortless yield in money market funds—what many viewed as “free parking”—is beginning to fade.
Still in the Game: Inflation matters more than ever
Inflation remains stubbornly above target. With the September inflation report now released, the Bureau of Labor Statistics reported headline CPI up 3.0% year-over-year and 0.3% month-to-month, while Core CPI decreased slightly to 3.0%1. These readings underscore the slow progress toward the Fed's 2% objective— and remind investors that even modest inflation can erode real returns on cash. Meanwhile, the ongoing government shutdown has disrupted the regular flow of official data, complicating the Fed's ability to assess both labor conditions and price pressures.
That uncertainty leaves policymakers cautious: a softer inflation trend may justify continued gradual easing, but persistent core inflation and limited data visibility could prompt patience—or even a pause—in future cuts. Either way, the situation underscores the importance of real return awareness, as policy visibility remains clouded and markets recalibrate in real time.
The Real vs. Nominal Yield Equation
It's understandable that investors have grown comfortable holding cash after two years of elevated short-term yields. But as the Fed eases, those yields will likely reset lower, even as inflation quietly diminishes their purchasing power. By comparison, short and intermediate bond funds offer the potential for:
- Higher real income over time
- Income generation through credit spread and carry, not just policy rates
- Capital preservation within a measured duration framework
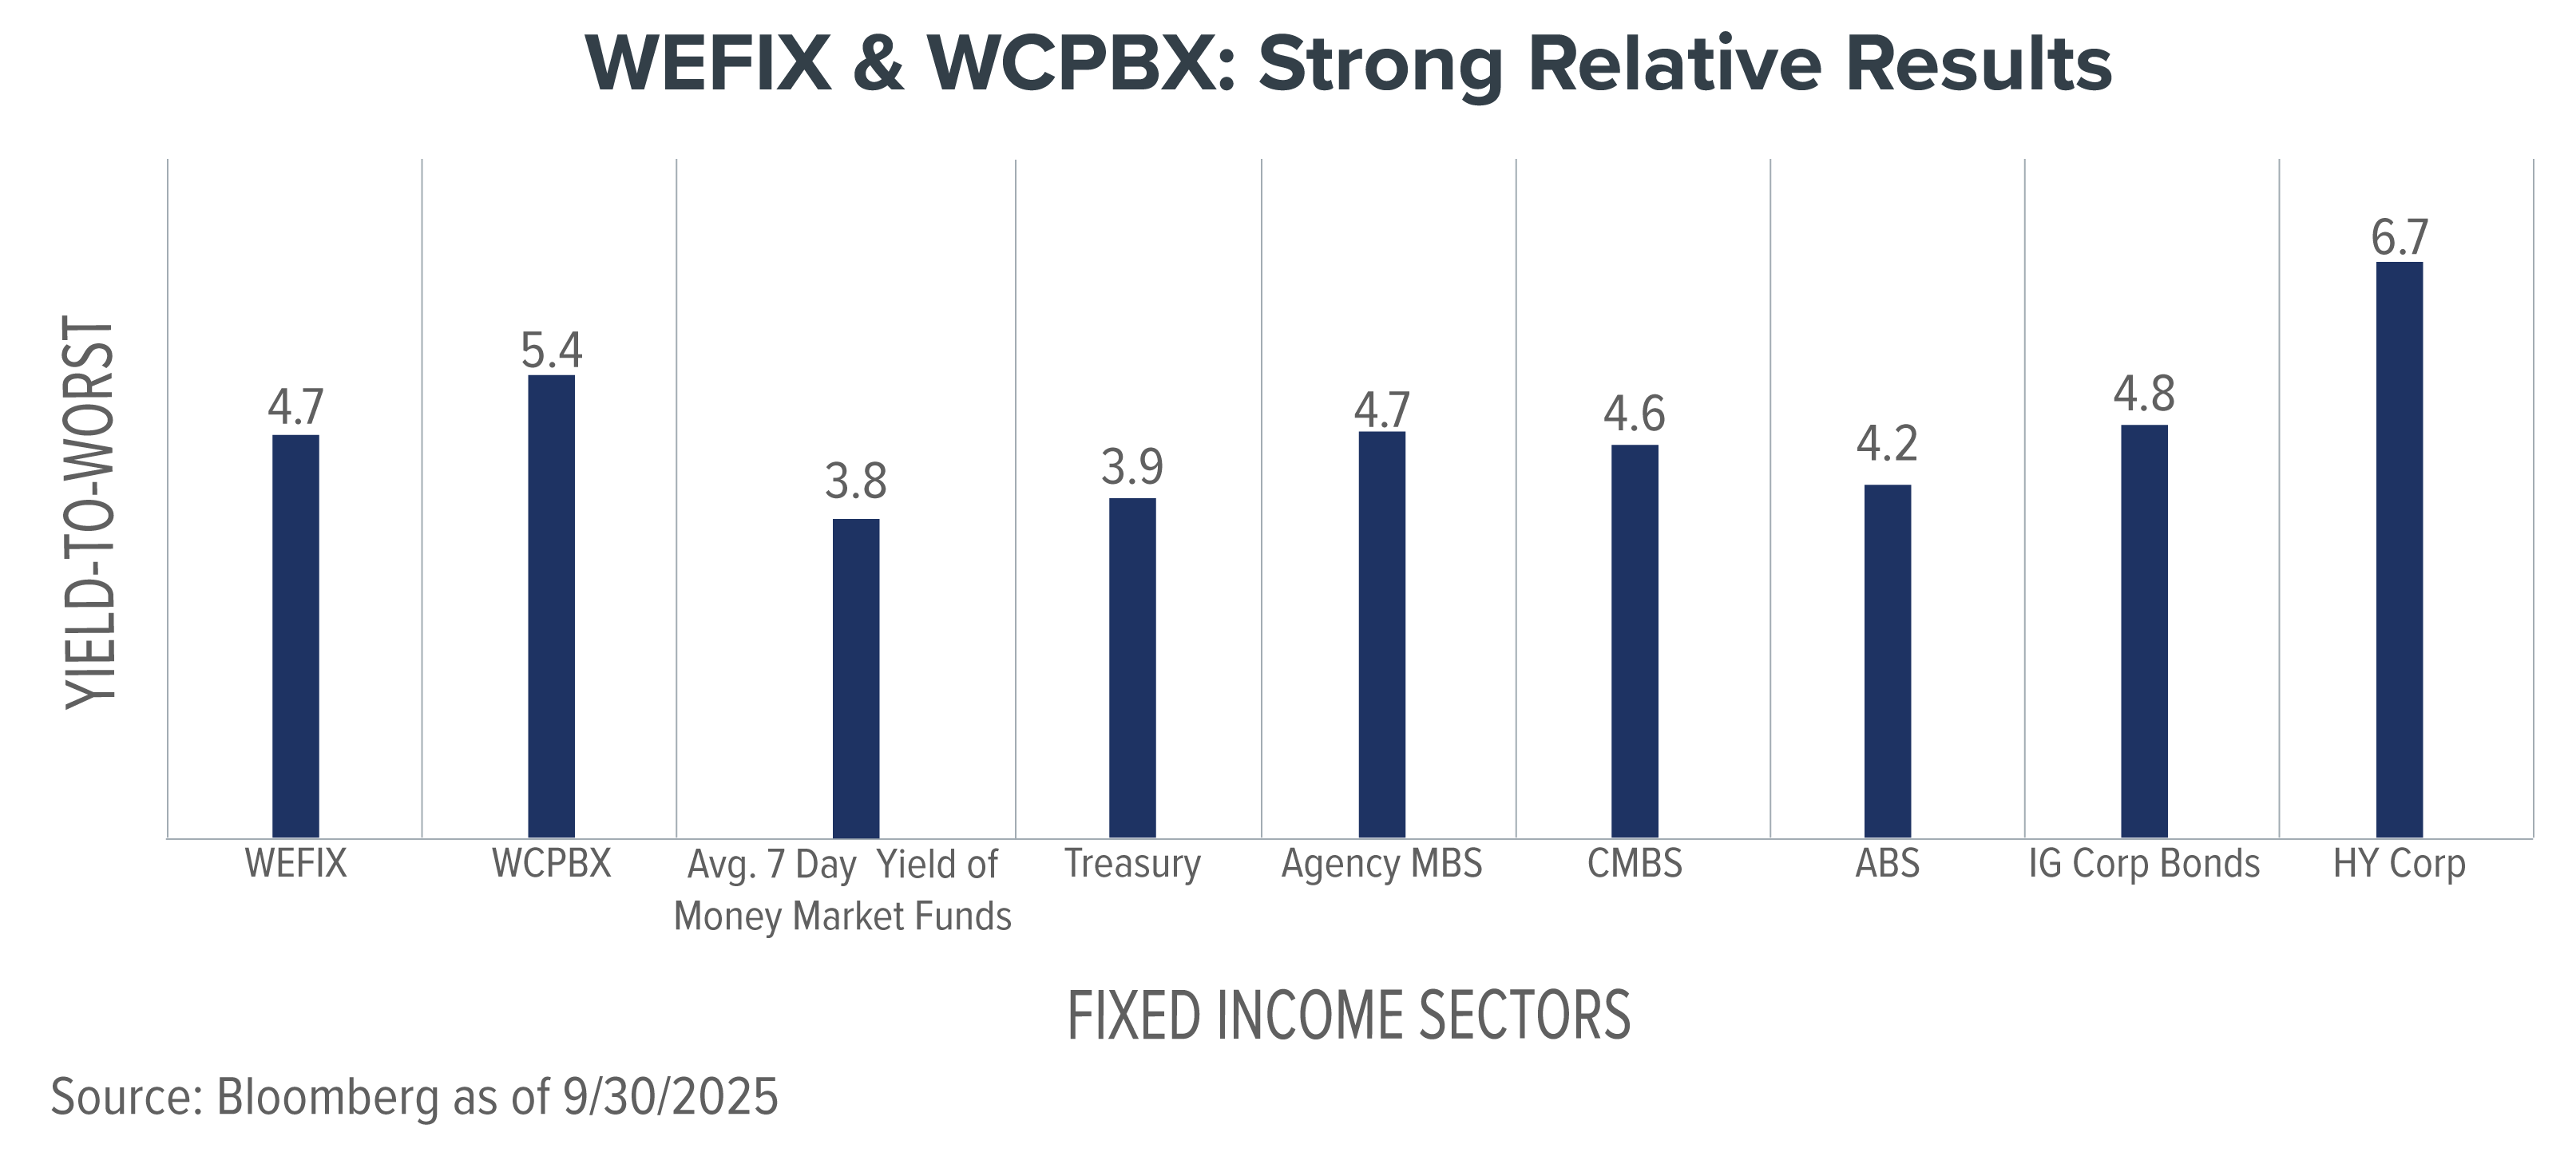
Recent market shifts have widened the yield-to-worst gap between cash and quality fixed income, presenting opportunities to improve portfolio efficiency without taking on excessive risk.
Advance strategically: Short and Intermediate Opportunities
Investors who are hesitant to extend fully into long-duration core bonds may find balance in short or intermediate strategies.
- Short Duration Funds (1—3 year duration) can help cushion against rate volatility while maintaining attractive yields.
- Intermediate Core Plus Funds incorporate spread sector and government security investments. This provides the potential for enhanced yields, while positioning investors to benefit from potential duration tailwinds, as rates move lower. (or something to this effect).
For instance, the Weitz Short Duration Income Fund (WEFIX) with its disciplined approach to income and preservation. Meanwhile, strategies such as the Weitz Core Plus Income Fund (WCPBX) may offer greater upside potential if the easing cycle unfolds as expected.
The Game has Changed: Play for Real Returns
Cash had its moment. But as rate cuts take effect and inflation lingers, investors face a new reality: the purchasing power of idle cash is quietly shrinking.
In this environment, real yield and flexibility—not simply nominal yield—should guide portfolio positioning. Whether through short-duration strategies for caution or intermediate funds for balance and opportunity, stepping out of cash may now be one of the most strategic moves an investor can make.
| RETURNS (%) |
| |
AVERAGE ANNUAL TOTAL RETURNS |
Net
Expense |
Gross
Expense |
| 1 YR |
3 YR |
5 YR |
10 YR |
| WEFIX Institutional Class |
4.96 |
5.88 |
3.06 |
2.76 |
0.45 |
0.54 |
| WSHNX Investor Class |
4.75 |
5.72 |
2.95 |
2.60 |
0.62 |
0.87 |
| WCPBX Institutional Class |
3.74 |
6.03 |
2.01 |
3.53 |
0.45 |
0.52 |
| WCPNX Investor Class |
3.53 |
5.89 |
1.90 |
3.38 |
0.65 |
0.78 |
| Bloomberg U.S. Agg 1–3 YR Index |
4.14 |
4.70 |
1.78 |
1.92 |
– |
– |
| Bloomberg U.S. Agg Bond Index |
2.88 |
4.92 |
-0.45 |
1.84 |
– |
– |
|
| YIELDS (%) |
| |
30-DAY SEC YIELD |
Distribution
Yield |
| |
Subsidized |
Unsubsidized |
|
| WEFIX |
4.65 |
4.60 |
4.58 |
| WSHNX |
4.45 |
4.26 |
4.38 |
| WCPBX |
5.14 |
5.10 |
5.05 |
| WCPNX |
4.94 |
4.85 |
4.85 |
|
1U.S. Bureau of Labor Statistics. Consumer Price Index Summary — September 2025. Released October 24, 2025. bls.gov
/sitefiles/live/documents/literature-and-publications/Market Perspective/_11.11.25_No Parking.pdf
IMPORTANT DISCLOSURES
Data is quoted as of 9/30/2025 unless otherwise indicated. Data quoted is past performance and current performance may be lower or higher. Past performance is no guarantee of future results. Investment return and principal value of an investment will fluctuate, and shares, when redeemed, may be worth more or less than their original cost. Please visit weitzinvestments.com for the most recent month-end performance.
The opinions expressed are those of Weitz Investment Management and are not meant as investment advice or to predict or project the future performance of any investment product. The opinions are current through 10/30/2025, are subject to change at any time based on market and other current conditions, and no forecasts can be guaranteed. This commentary is being provided as a general source of information and is not intended as a recommendation to purchase, sell, or hold any specific security or to engage in any investment strategy. Investment decisions should always be made based on an investor's specific objectives, financial needs, risk tolerance and time horizon.
This material must be preceded or accompanied by a prospectus or summary prospectus.
Effective 12/16/2016, the Short Duration Income Fund revised its principal investment strategies. Since that time the Fund has generally maintained an average effective duration between one to three and a half years. Prior to that date, the Fund maintained a dollar-weighted average maturity of between two to five years. Performance prior to 12/16/2016 reflects the Fund's prior principal investment strategies and may not be indicative of future performance results.
The Short Duration Income Fund has entered into a fee waiver and/or expense reimbursement arrangement with the Investment Advisor by which the Advisor has contractually agreed to waive a portion of the Advisor's fee and reimburse certain expenses (excluding taxes, interest, brokerage costs, acquired fund fees and expenses and extraordinary expenses) to limit the total annual fund operating expenses of the Fund's average daily net assets through 7/31/2026. The gross expense ratio reflects the total annual operating expenses of the fund, before any fee waivers or reimbursements. The net expense ratio reflects the total annual operating expenses of the fund after taking into account any fee waiver and/or expense reimbursement. The net expense ratio represents what investors are ultimately charged to be invested in a mutual fund.
Index performance is hypothetical and is shown for illustrative purposes only. You cannot invest directly in an index. The Core Plus Income Fund has compared its performance to the Bloomberg U.S. Aggregate Bond Index, which is a broad-based benchmark that measures the investment grade, U.S. dollar-denominated, fixed-rate taxable bond market. The Short Duration Income Fund has compared its performance to the Bloomberg 1-3 Year U.S. Aggregate Index, which is generally representative of the market for investment grade, U.S. dollar denominated, fixed-rate taxable bonds with maturities from one to three years. The Short Duration Income Fund has also selected the Bloomberg U.S. Aggregate Bond Index as its broad-based index for regulatory requirements.
Holdings are subject to change and may not be representative of the Fund's current or future investments.
© 2026 Morningstar, Inc. All Rights Reserved. The information contained herein: (1) is proprietary to Morningstar; (2) may not be copied or distributed; and (3) is not warranted to be accurate, complete or timely. Neither Morningstar nor its content providers are responsible for any damages or losses arising from any use of this information. Past performance is no guarantee of future results.
Morningstar percentile rank is a standardized way of ranking items within a peer group, in this case, funds with the same Morningstar category. The observation with the largest numerical value is ranked one; the observation with the smallest numerical value is ranked 100. The remaining observations are placed equal distance from one another on the rating scale.
The Morningstar Rating™ for funds, or "star rating", is calculated for managed products (including mutual funds, variable annuity and variable life subaccounts, exchange-traded funds, closed-end funds, and separate accounts) with at least a three-year history. Exchange-traded funds and open-ended mutual funds are considered a single population for comparative purposes. It is calculated based on a Morningstar Risk-Adjusted Return measure that accounts for variation in a managed product's monthly excess performance, placing more emphasis on downward variations and rewarding consistent performance. The Morningstar Rating does not include any adjustment for sales loads. The top 10% of products in each product category receive 5 stars, the next 22.5% receive 4 stars, the next 35% receive 3 stars, the next 22.5% receive 2 stars, and the bottom 10% receive 1 star. The Overall Morningstar Rating for a managed product is derived from a weighted average of the performance figures associated with its three-, five-, and 10-year (if applicable) Morningstar Rating metrics. The weights are: 100% three-year rating for 36-59 months of total returns, 60% five-year rating/40% three-year rating for 60-119 months of total returns, and 50% 10-year rating/30% five-year rating/20% three-year rating for 120 or more months of total returns. While the 10-year overall star rating formula seems to give the most weight to the 10-year period, the most recent three-year period actually has the greatest impact because it is included in all three rating periods.
Definitions: Yield to Worst (YTW) is the lowest potential yield that can be received on a bond portfolio without the issuers actually defaulting. Average Coupon is the weighted average coupon rate of each bond in the portfolio. The Consumer Price Index (CPI) is a measure of the average change over time in the prices paid by consumers for a representative basket of consumer goods and services. The CPI measures inflation as experienced by consumers in their day-to-day living expenses.
Consider these risks before investing: All investments involve risks, including possible loss of principal. Market risk includes political, regulatory, economic, social and health risks (including the risks presented by the spread of infectious diseases). Changing interest rates may have sudden and unpredictable effects in the markets and on the Fund's investments. The Fund may purchase lower-rated and unrated fixed-income securities, which involve an increased possibility that the issuers of these may not be able to make payments of interest and principal. See the Fund's prospectus for a further discussion of risks.