Not All Spread Is Credit Risk: How We Think About Risk Allocation

A common explanation for excess returns in fixed income is that managers simply take more risk. Industry studies frequently attribute excess returns to heavier allocations to credit or higher-yielding sectors, reinforcing the idea that “alpha” is simply a byproduct of greater risk exposure.
We think the reality is more nuanced: not all risks are the same, and not all sources of return are created equal. In fixed income, outcomes are shaped not only by how much risk is taken, but by the types of risk a portfolio assumes and how those risks are managed over time.
Defining Risk—and What
“Active” Is Measured Against
One of the challenges in evaluating active fixed income strategies is defining what “active” actually means—and what it is being measured against.
The Bloomberg U.S. Aggregate Index (“the Agg”) serves as a common benchmark for many fixed income strategies. But the Agg is not a neutral representation of the broader bond market. Its composition is driven by index eligibility rules and issuance patterns, resulting in significant exclusions—including high yield, floating-rate debt, and many securitized assets.
As a result, “active” positioning is often measured relative to a benchmark that reflects only a portion of the investable universe.
At the same time, risk in fixed income is often simplified to “credit risk.” In practice, portfolios are exposed to multiple forms of risk, including:
- Interest rate risk (duration positioning relative to the benchmark)
- Credit risk (which can vary meaningfully by structure and sector)
- Liquidity and structural risk (including risks associated with how securities are structured and traded)
- Spread duration, reflecting sensitivity to changes in credit spreads rather than interest rates
Understanding how these risks are defined—and how they are allocated—is critical to evaluating active management.
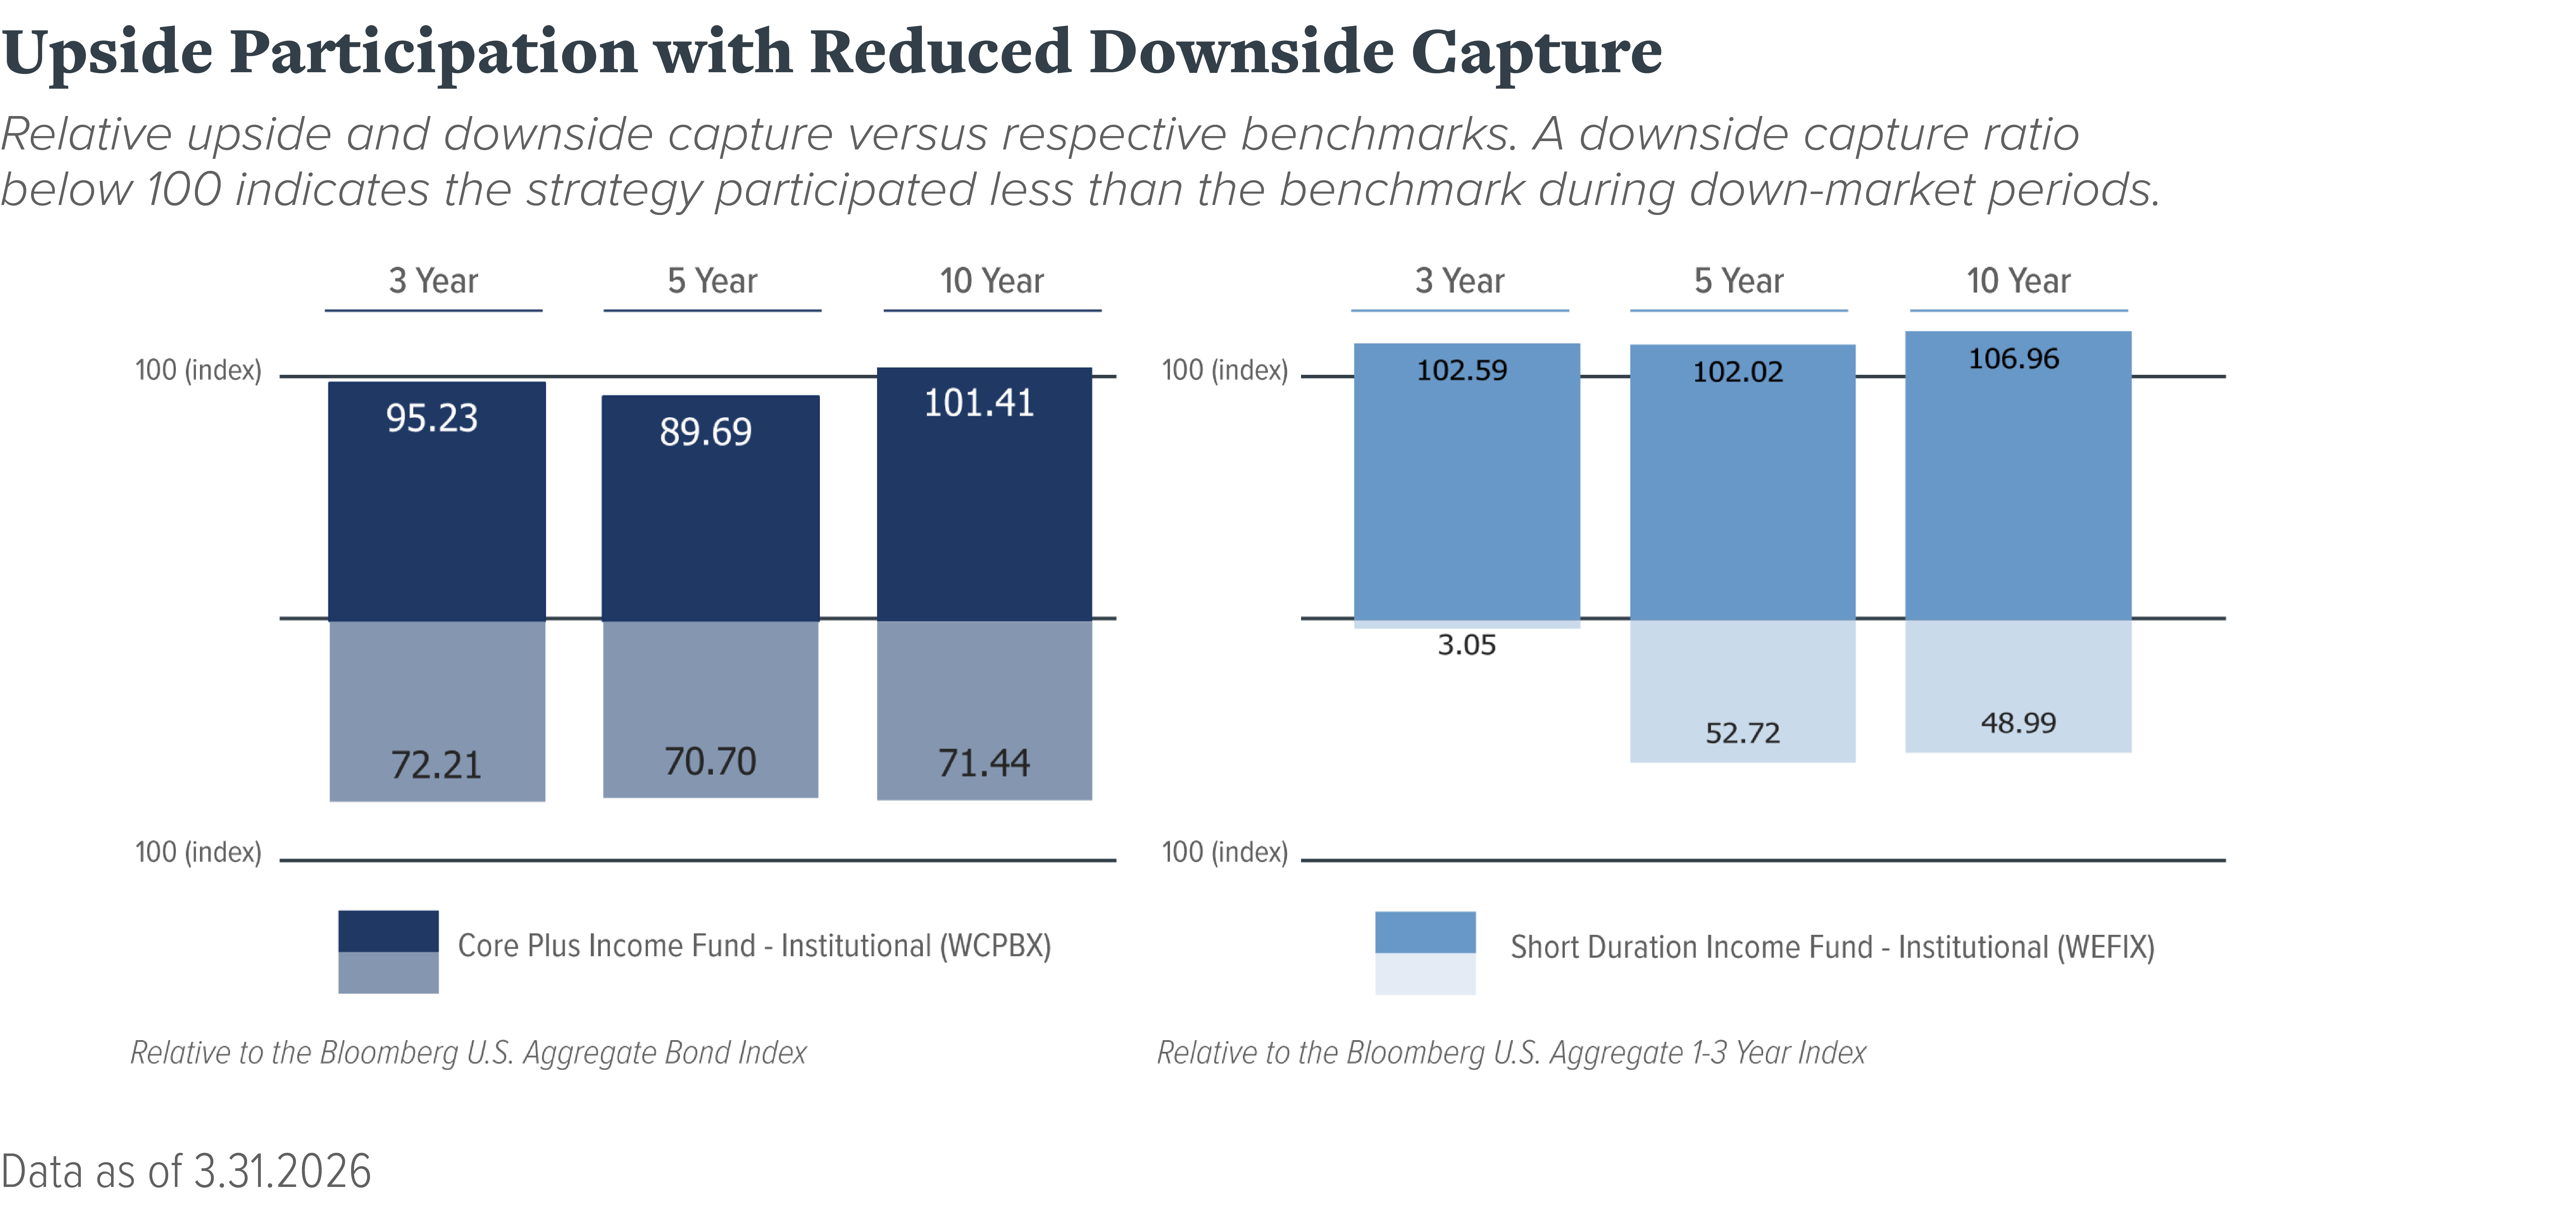
The impact of these decisions can be seen in how portfolios participate across different market environments. Historically, our Core Plus and Short Duration strategies have captured much of the upside of their respective benchmarks while participating in less of the downside. While past performance does not guarantee future results, we believe these outcomes reflect the importance of risk selection and portfolio construction—not simply the pursuit of higher yield.
Not All Spread Is Credit Risk—
and Not All Credit Risk Is the Same.
At Weitz, we often allocate risk differently than traditional benchmark-oriented strategies. Rather than relying primarily on corporate credit exposure, we may emphasize securitized and structured credit sectors such as:
- Asset-Backed Securities (ABS)
- Commercial Mortgage-Backed Securities (CMBS)
- Collateralized Loan Obligations (CLOs)
- Non-Qualified Mortgage Securities (Non-QM)
These sectors can offer different drivers of return than traditional corporate bonds. Performance may depend not only on issuer credit quality, but also on collateral characteristics, deal structure, market liquidity, and security-level complexity.
In fixed income, spread is often used as shorthand for the additional yield investors receive above comparable term Treasury securities. While spread is frequently associated with credit risk, it can also reflect liquidity, structure, complexity, and other factors.
Importantly, spreads in these sectors do not always represent the same risks embedded in traditional corporate credit. In many cases, investors may also be compensated for factors such as liquidity, structural complexity, or market inefficiencies. For example, a securitized bond may offer additional yield because it is less liquid or requires specialized analysis, not necessarily because the underlying collateral is of lower quality.
By allocating across different types of risk exposures, we seek to build portfolios that are diversified not simply by issuer, but by underlying sources of return and risk.
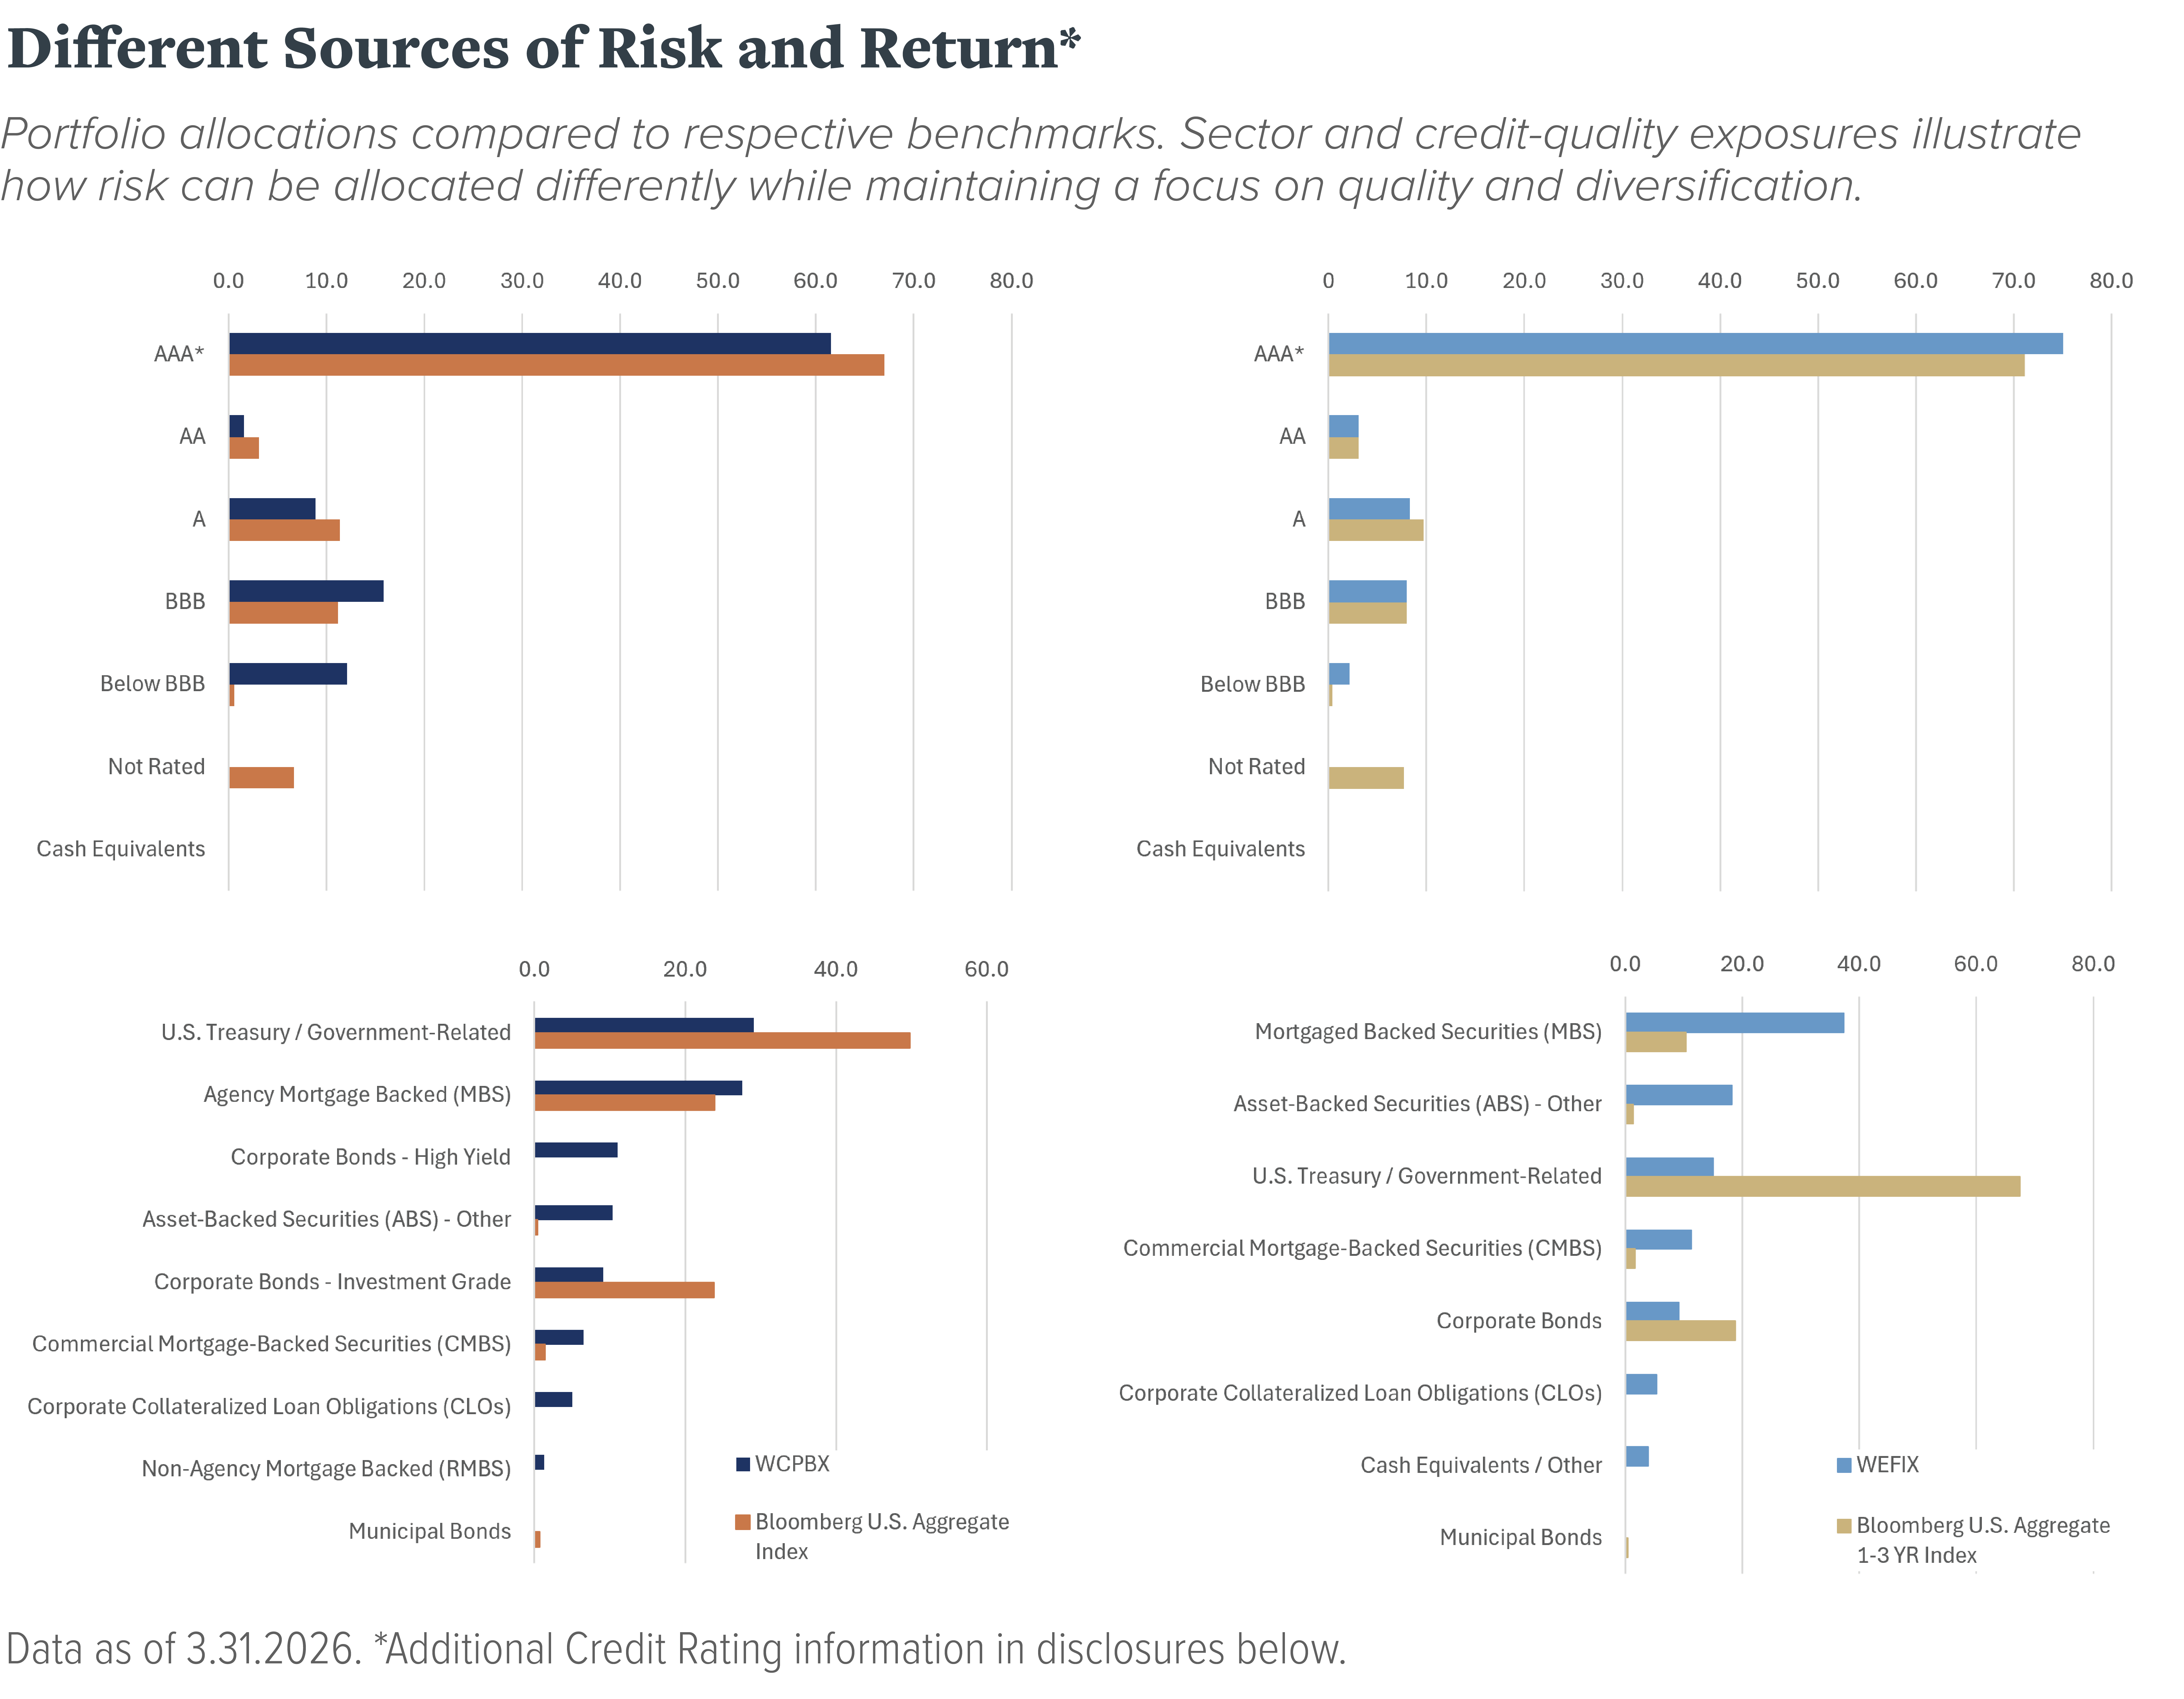
The differences between traditional benchmark exposures and our portfolios can be seen in the allocation profile below. While broad fixed income benchmarks are heavily concentrated in government-related securities, our portfolios may allocate more meaningfully to securitized sectors and other areas where we believe investors are being compensated for risks beyond traditional corporate credit exposure.
Managing Risk
Beyond the Benchmark
The real value of active management in fixed income is not just in seeking excess return, but in actively managing risk:
- Adjusting sector exposures and duration as conditions change
- Reposition duration and yield curve exposure
- Reallocating capital when relative value shifts
- Avoiding areas where compensation does not justify risk
This flexibility allows us to adjust portfolios as valuations, relative opportunities, and market conditions change.. Our Core Plus strategy embodies this philosophy, and our Short Duration strategy applies it with even tighter guardrails—prioritizing capital preservation and liquidity. Outcomes are shaped not just by market exposure, but by how risk is selected, structured, and managed over time.
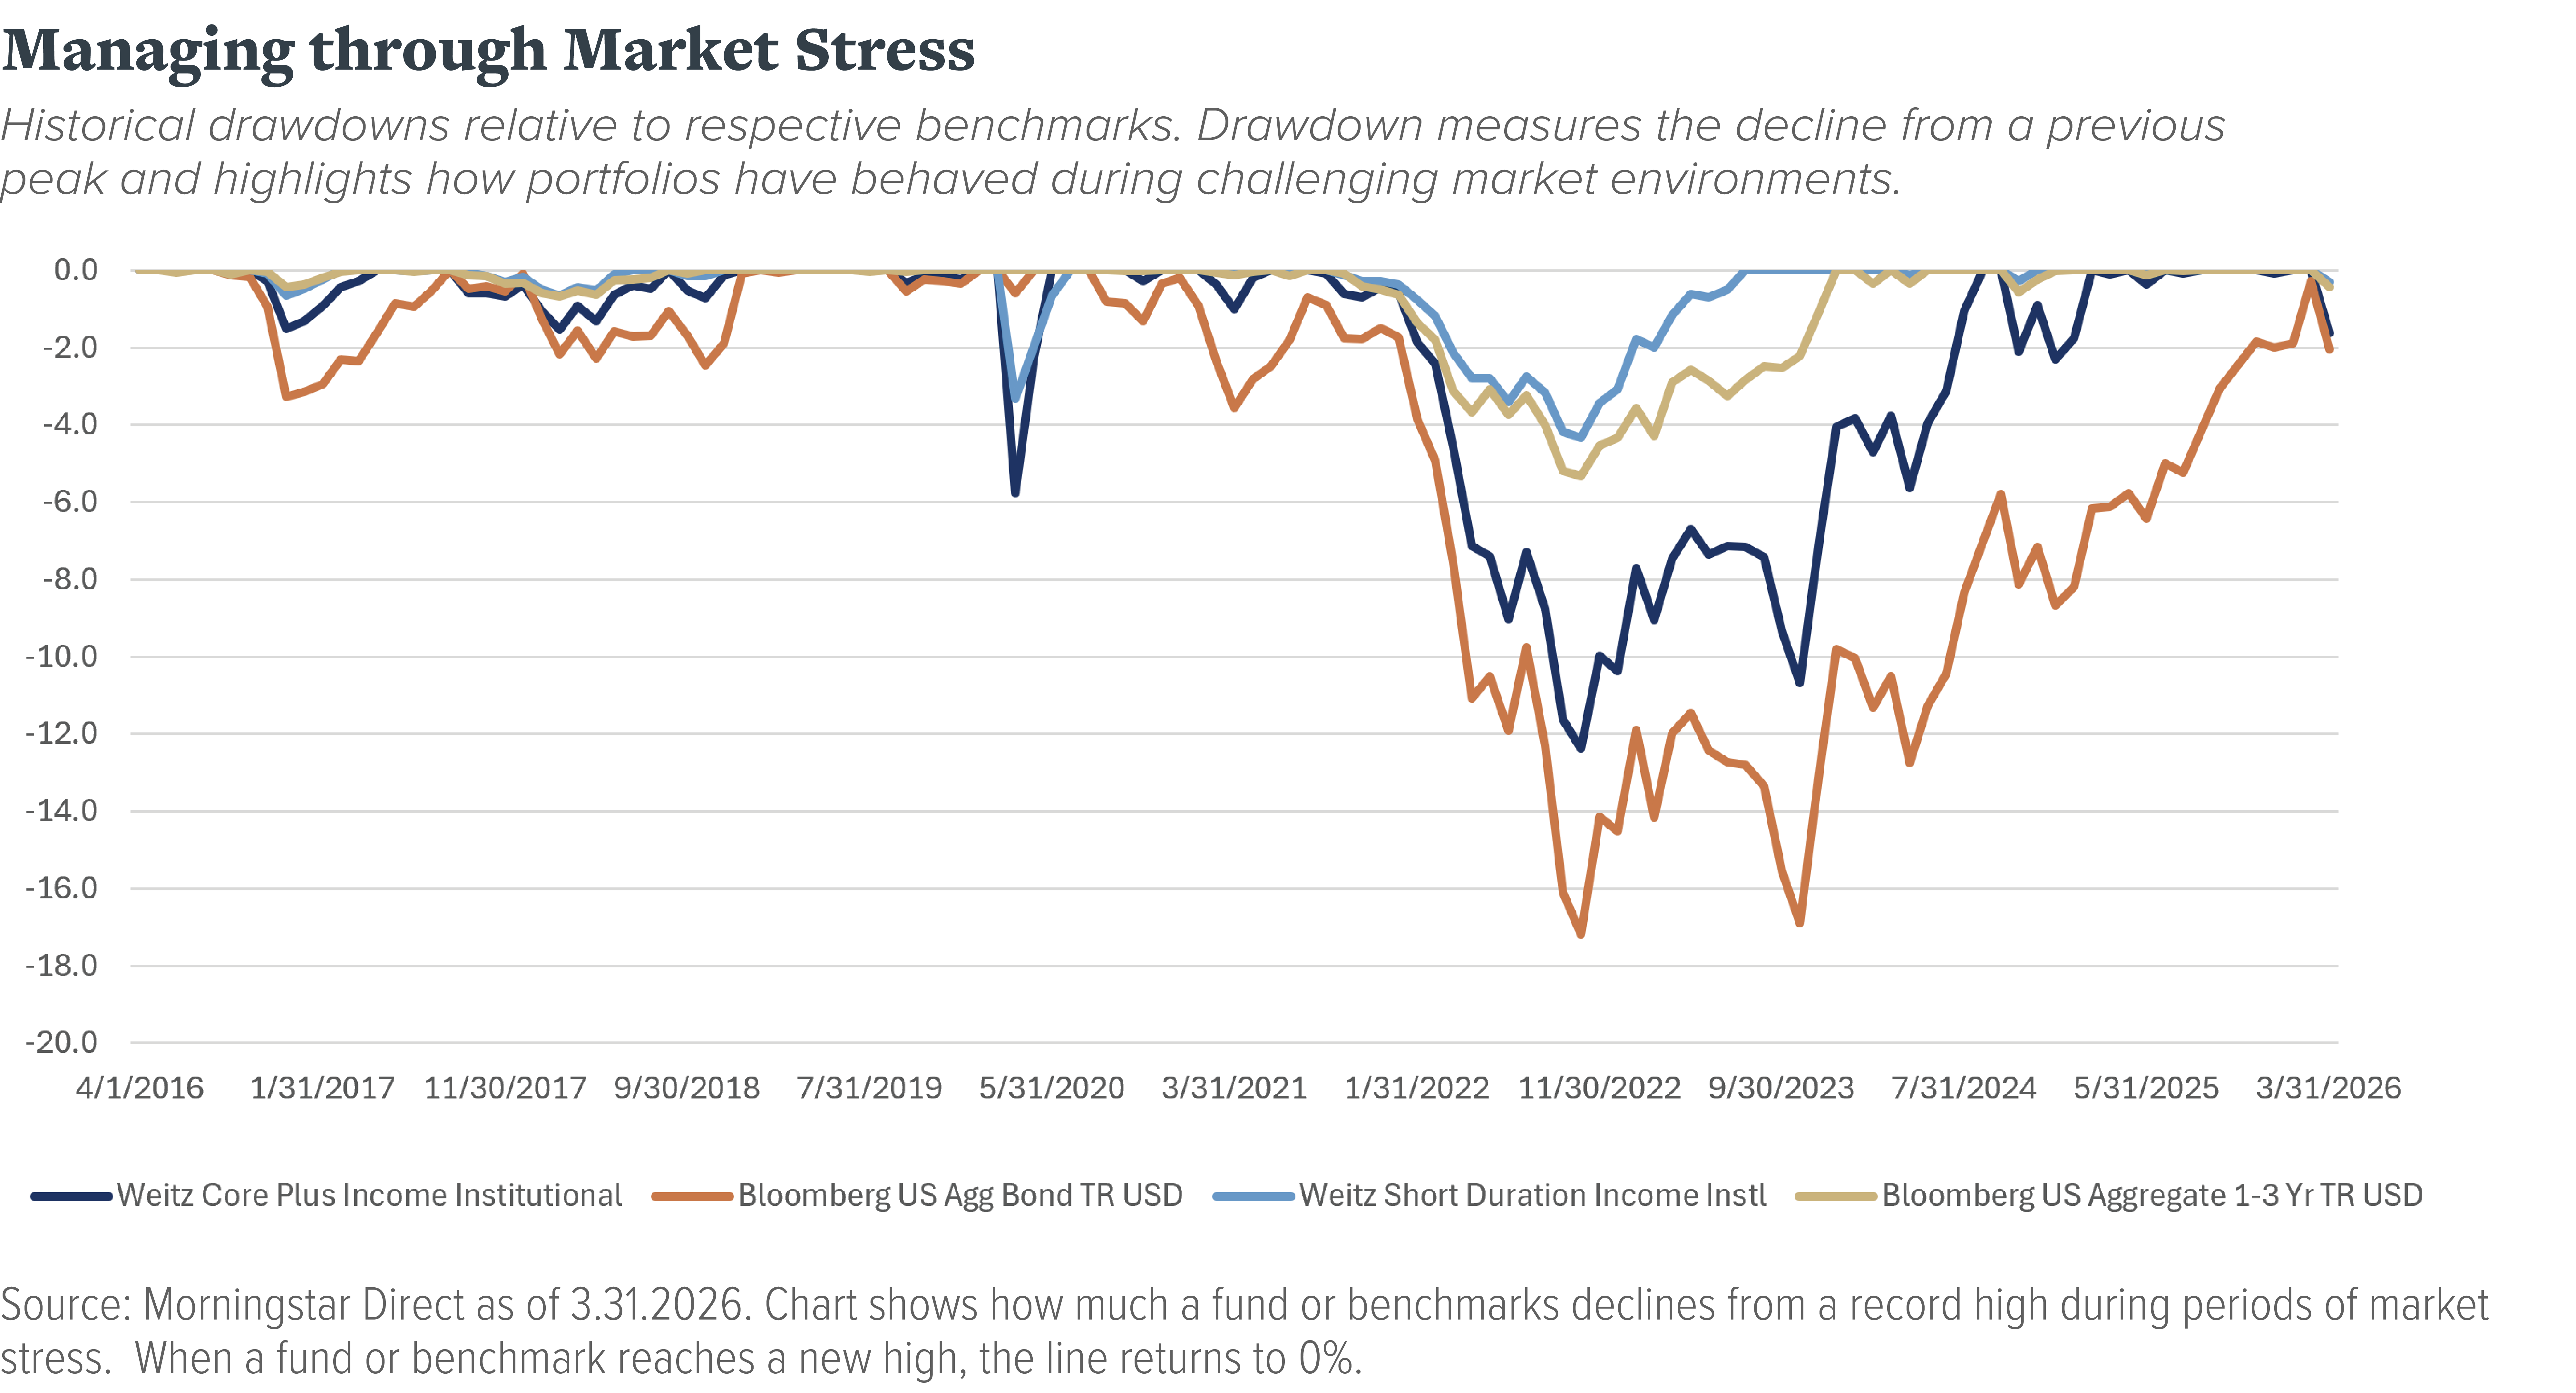
The benefits of risk allocation are often most visible during periods of market stress. While every market environment is different, the historical drawdown experience of our strategies illustrates how portfolio construction decisions can influence downside outcomes and recovery paths over time.
Consistency Through the Cycle
Long-term success in fixed income comes not just from participating in up markets, but from managing through periods of stress. Preserving capital, reducing drawdowns, and compounding consistently are key to better investor outcomes over time.
For that reason, our process emphasizes discipline, selectivity, and consistency across market environments. We seek to participate meaningfully when opportunities are attractive while maintaining a focus on quality, liquidity, and risk management throughout the cycle.
A More Complete
View of Active Management
The notion that “active” simply means “riskier” may reflect broad industry trends, but it does not reflect the choices we make at Weitz.
For us, active management means being deliberate about where and how risk is taken. It means allocating across a broader opportunity set, evaluating risks beyond traditional benchmark categories, and constructing portfolios with a long-term focus on quality and consistency.
In our view, the more important question is not how much risk a portfolio takes, but what risks it takes and whether investors are being adequately compensated for them.
| Average Annual Total Returns (%) as of 3.31.2026 |
|
1 YR |
3 YR |
5 YR |
10 YR |
|
Core Plus Income Fund - Institutional (WCPBX)
expense ratio: 0.45% (net) | 0.52% (gross)
|
4.77 |
4.88 |
1.93 |
3.47 |
| Bloomberg U.S. Aggregate Bond Index |
4.35 |
3.63 |
0.31 |
1.56 |
|
Short Duration Income Fund - Institutional (WEFIX)
expense ratio: 0.45% (net) | 0.53% (gross)
|
4.60 |
5.41 |
3.12 |
2.85 |
| Bloomberg U.S. Aggregate 1-3 Yr Index |
4.03 |
4.39 |
2.06 |
2.01 |
/sitefiles/live/documents/literature-and-publications/Market Perspective/6.2026 Not All Spread Is Credit Risk.pdf
Data is quoted as of 3/31/2026 unless otherwise indicated. Data quoted is past performance and current performance may be lower or higher. Past performance is no guarantee of future results. Investment return and principal value of an investment will fluctuate, and shares, when redeemed, may be worth more or less than their original cost. Please visit weitzinvestments.com for the most recent month-end performance.
The opinions expressed are those of Weitz Investment Management and are not meant as investment advice or to predict or project the future performance of any investment product. The opinions are current through 6/8/2026, are subject to change at any time based on market and other current conditions, and no forecasts can be guaranteed. This commentary is being provided as a general source of information and is not intended as a recommendation to purchase, sell, or hold any specific security or to engage in any investment strategy. Investment decisions should always be made based on an investor's specific objectives, financial needs, risk tolerance and time horizon.
Effective 12/16/2016, the Short Duration Income Fund revised its principal investment strategies. Since that time the Fund has generally maintained an average effective duration between one to three and a half years. Prior to that date, the Fund maintained a dollar-weighted average maturity of between two to five years. Performance prior to 12/16/2016 reflects the Fund's prior principal investment strategies and may not be indicative of future performance results.
The Short Duration Income Fund has entered into a fee waiver and/or expense reimbursement arrangement with the Investment Advisor by which the Advisor has contractually agreed to waive a portion of the Advisor's fee and reimburse certain expenses (excluding taxes, interest, brokerage costs, acquired fund fees and expenses and extraordinary expenses) to limit the total annual fund operating expenses of the Fund's average daily net assets through 7/31/2026. The gross expense ratio reflects the total annual operating expenses of the fund, before any fee waivers or reimbursements. The net expense ratio reflects the total annual operating expenses of the fund after taking into account any fee waiver and/or expense reimbursement. The net expense ratio represents what investors are ultimately charged to be invested in a mutual fund.
Index performance is hypothetical and is shown for illustrative purposes only. You cannot invest directly in an index. The Short Duration Income Fund has compared its performance to the Bloomberg 1-3 Year U.S. Aggregate Index, which is generally representative of the market for investment grade, U.S. dollar denominated, fixed-rate taxable bonds with maturities from one to three years. The Core Plus Income Fund has compared its performance to the Bloomberg U.S. Aggregate Bond Index, which is a broad-based benchmark that measures the investment grade, U.S. dollar-denominated, fixed-rate taxable bond market. The Short Duration Income Fund has also selected the Bloomberg U.S. Aggregate Bond Index as its broad-based index for regulatory requirements.
*Credit ratings are assigned to underlying securities utilizing ratings from a Nationally Recognized Statistical Rating Organization (NRSRO) such as Moody's and Fitch, or other rating agencies and applying the following hierarchy: security is determined to be Investment Grade if it has been rated at least BBB- by one credit rating agency; once determined to be Investment Grade (BBB- and above) or Non-Investment Grade (BB+ and below) where multiple ratings are available, then the lowest rating is assigned. Mortgage-related securities issued and guaranteed by government-sponsored agencies such as Fannie Mae and Freddie Mac are generally not rated by rating agencies. Securities that are not rated do not necessarily indicate low quality. Ratings are shown in the Fitch scale (e.g., AAA). Ratings and portfolio credit quality may change over time. The Fund itself has not been rated by a credit rating agency.
Consider these risks before investing: All investments involve risks, including possible loss of principal. Market risk includes political, regulatory, economic, social and health risks (including the risks presented by the spread of infectious diseases). Changing interest rates may have sudden and unpredictable effects in the markets and on the Fund›s investments. The Fund may purchase lower-rated and unrated fixed-income securities, which involve an increased possibility that the issuers of these may not be able to make payments of interest and principal. See the Fund›s prospectus for a further discussion of risks.