From Tariffs to Tranquility
Vice President, Co-Head of Fixed Income, Portfolio Manager
×
x

Tom Carney, CFA®
Vice President, Co-Head of Fixed Income, Portfolio Manager
Multisector Bond ETF (Since November 2025)
Core Plus Bond ETF (Since August 2025)
Core Plus Income Fund (Since July 2014)
Short Duration Income Fund (Since January 1996)
Ultra Short Government Fund (Since January 1996)
Investment industry experience since 1982
Tom joined Weitz Investment Management in 1995
as an equity trader. He was promoted to
co-portfolio manager in 1996 and to portfolio manager in 1999. Prior
to joining the firm, Tom held several positions at Chiles, Heider & Co.,
Inc. Previously, he was a municipal securities professional with Smith
Barney. Tom has a bachelor's in finance from the University of Nebraska
Omaha.
Vice President, Co-Head of Fixed Income, Portfolio Manager
×
x

Nolan P. Anderson
Vice President, Co-Head of Fixed Income, Portfolio Manager
Multisector Bond ETF(Since November 2025)
Core Plus Bond ETF(Since August 2025)
Core Plus Income Fund (Since July 2014)
Short Duration Income Fund (Since July 2017)
Ultra Short Government Fund (Since December 2016)
Conservative Allocation Fund (Since July 2021)
Investment industry experience since 2004
Nolan joined Weitz Investment Management in 2011 as a fixed income research analyst. In 2014, he was promoted to portfolio manager. Prior to joining the firm, Nolan performed financial modeling and due diligence on leveraged buyout transactions for Wells Fargo Bank. Previously, he worked for WoodmenLife as a commercial real estate mortgage analyst. Nolan has a bachelor's in real estate and land use economics, and an MBA from the University of Nebraska Omaha.

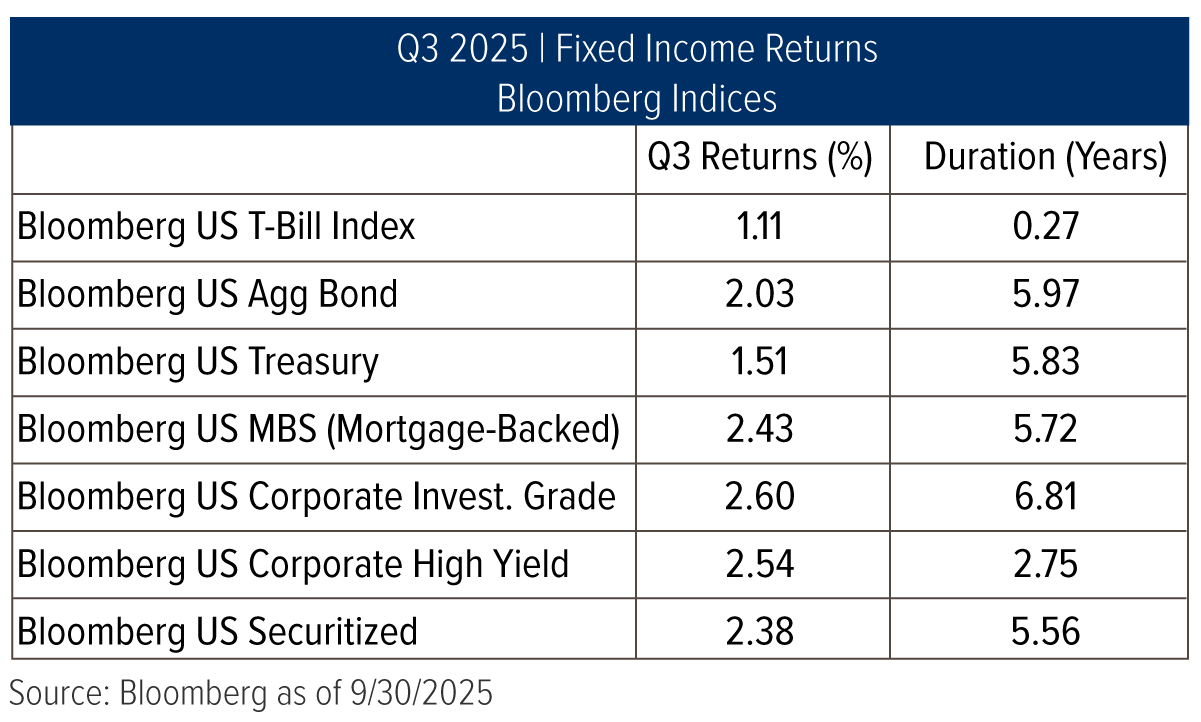
Despite continued economic, geopolitical and monetary policy uncertainty here and abroad, fixed income markets continued their resilient or Teflon-like behavior mentioned in the previous Fixed Income Insights letter. In U.S. fixed income markets, investment-grade and high-yield corporate bonds led third-quarter returns as both interest rate and credit sensitive assets performed well.
Third quarter headlines were led by the ever-expanding AI capital spending cycle (now including large sums of leverage) and its economic implications, potential thawing (or not) of US-China relations, the White House's attempt to fire and pressure a Federal Reserve governor, the remarkable rally in gold and silver, and the U.S. government taking ownership in private businesses.
With all the tumult around Fed independence, all eyes were on the Fed ahead of its September 17th policy meeting. The Fed delivered a highly anticipated 25-basis point (bps) cut, taking the target range to 4.00-4.25%, with only one dissent comingfrom new (temporary) Fed Governor Stephen Miran, who preferred a more aggressive 50 bps cut. Despite wide dispersion in the expected path of rates among Federal Reserve members, given debate around sticky inflation vs. slowing hiring, the median 2025 year-end fed funds target is 3.50-3.75%, implying two more cuts ahead this year.
However, during Powell's press conference, he stated, “We have a situation where we have two-sided risk, and that means there's no risk-free path.” Despite these cautionary words, financial markets continue to price a tranquil environment where growth, inflation, monetary policy, and geopolitical risk remain just right.
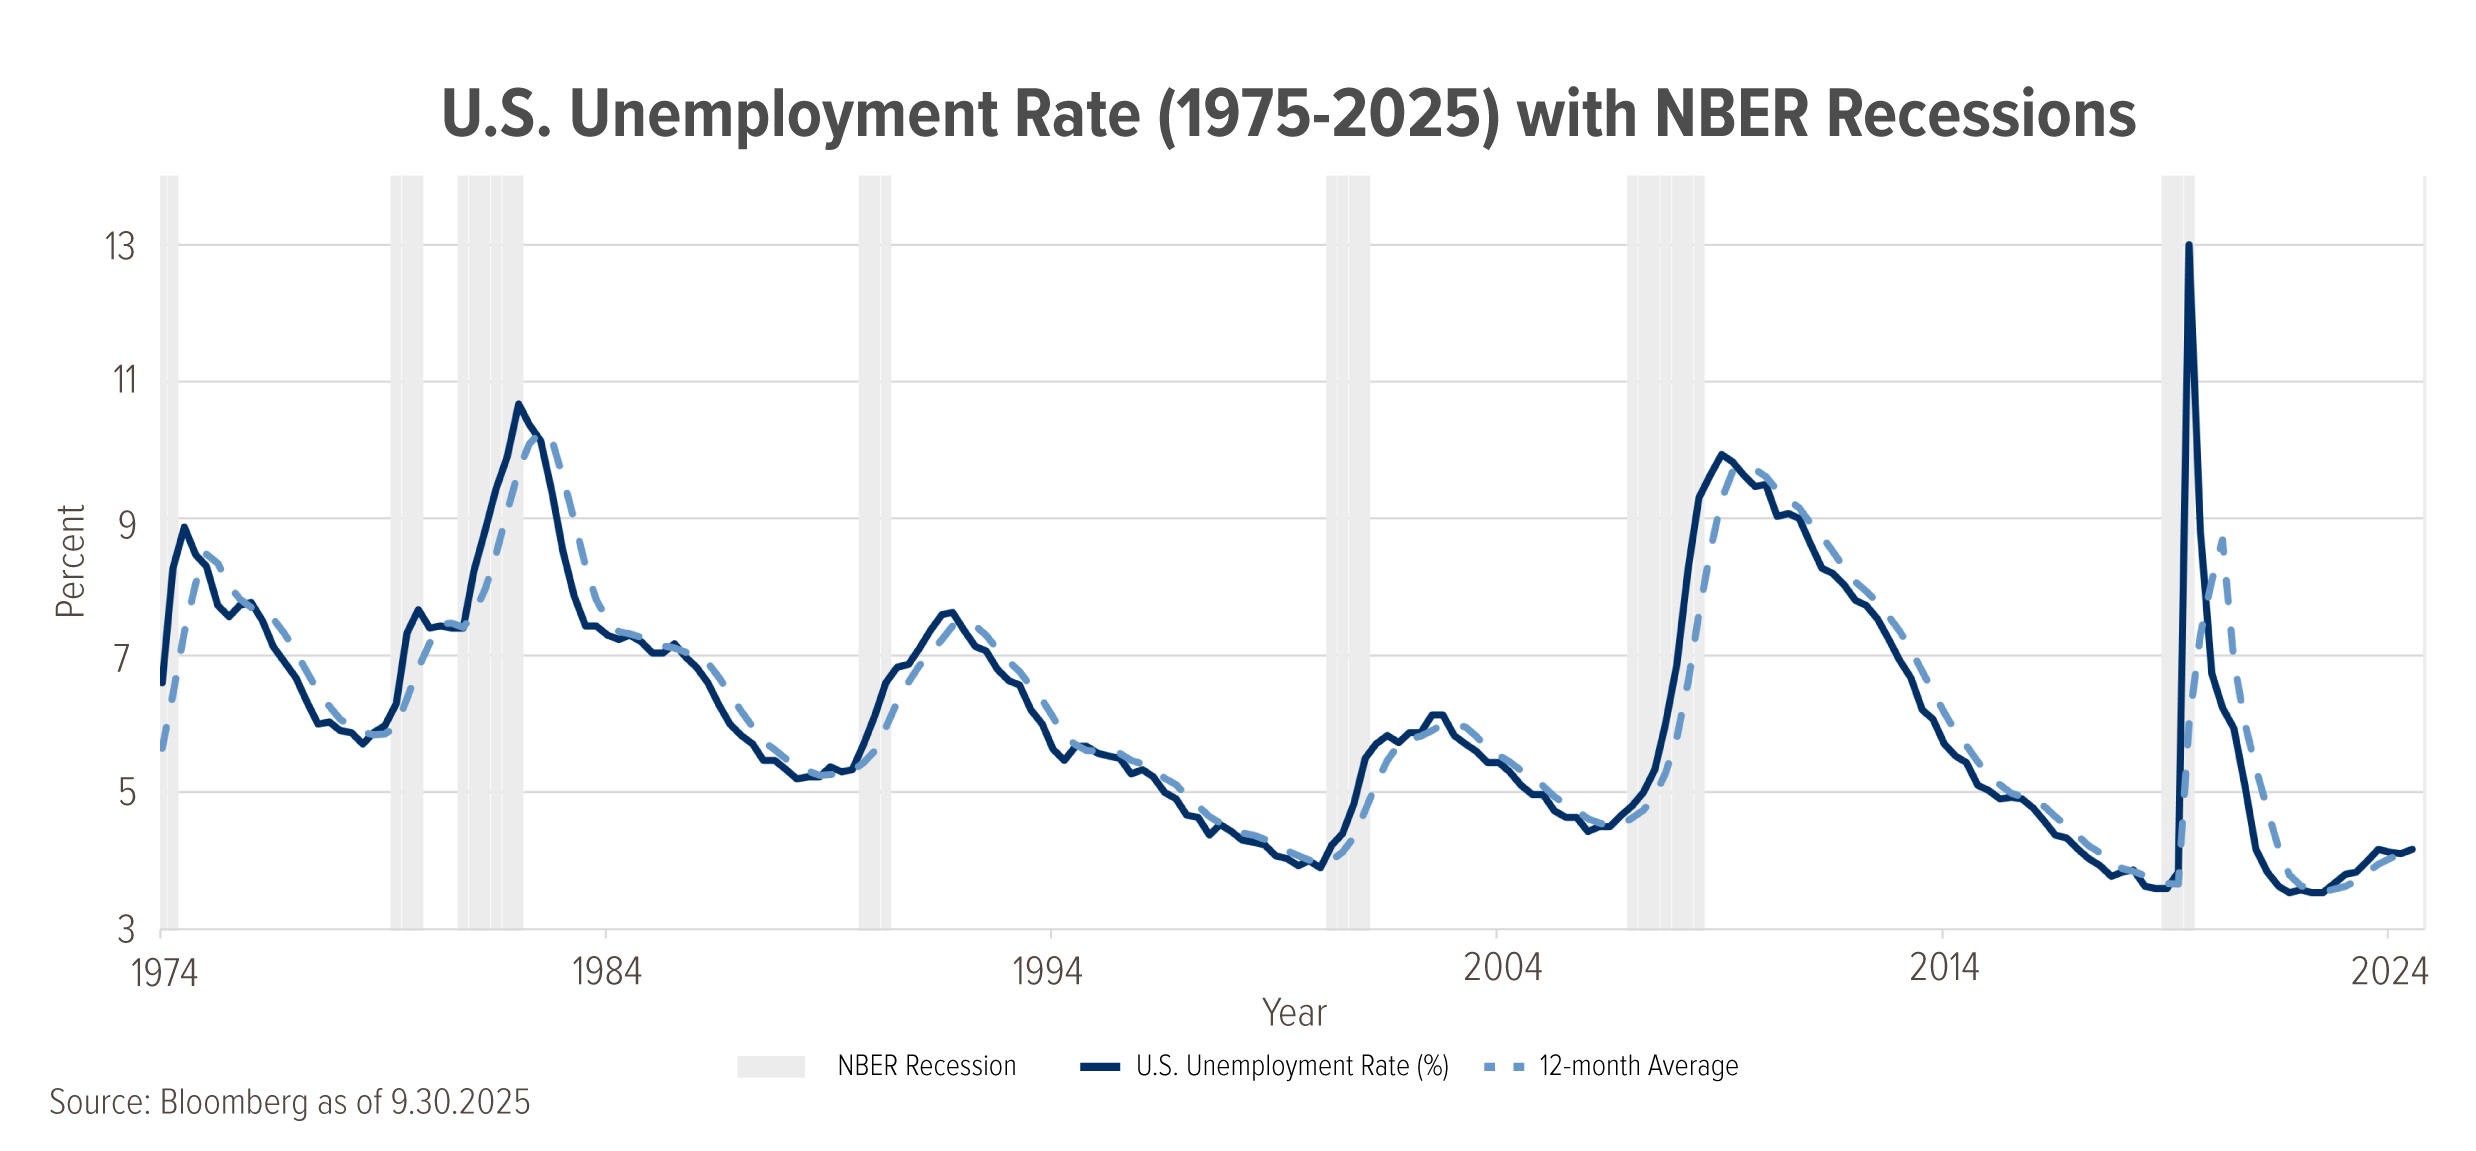
While job growth has clearly slowed, the August 2025 unemployment rate of 4.3% remains low by historical standards (see chart below) and below previous troughs in unemployment in prior cycles. For context, since 1948, the U.S. employment rate averaged 5.7%. Moreover, the unemployment rate is considered a lagging economic indicator. This is because employers typically adjust labor after new economic trends become apparent. Before making hiring/firing decisions, companies may choose first to cut hours, freeze hiring and/or reduce bonuses.
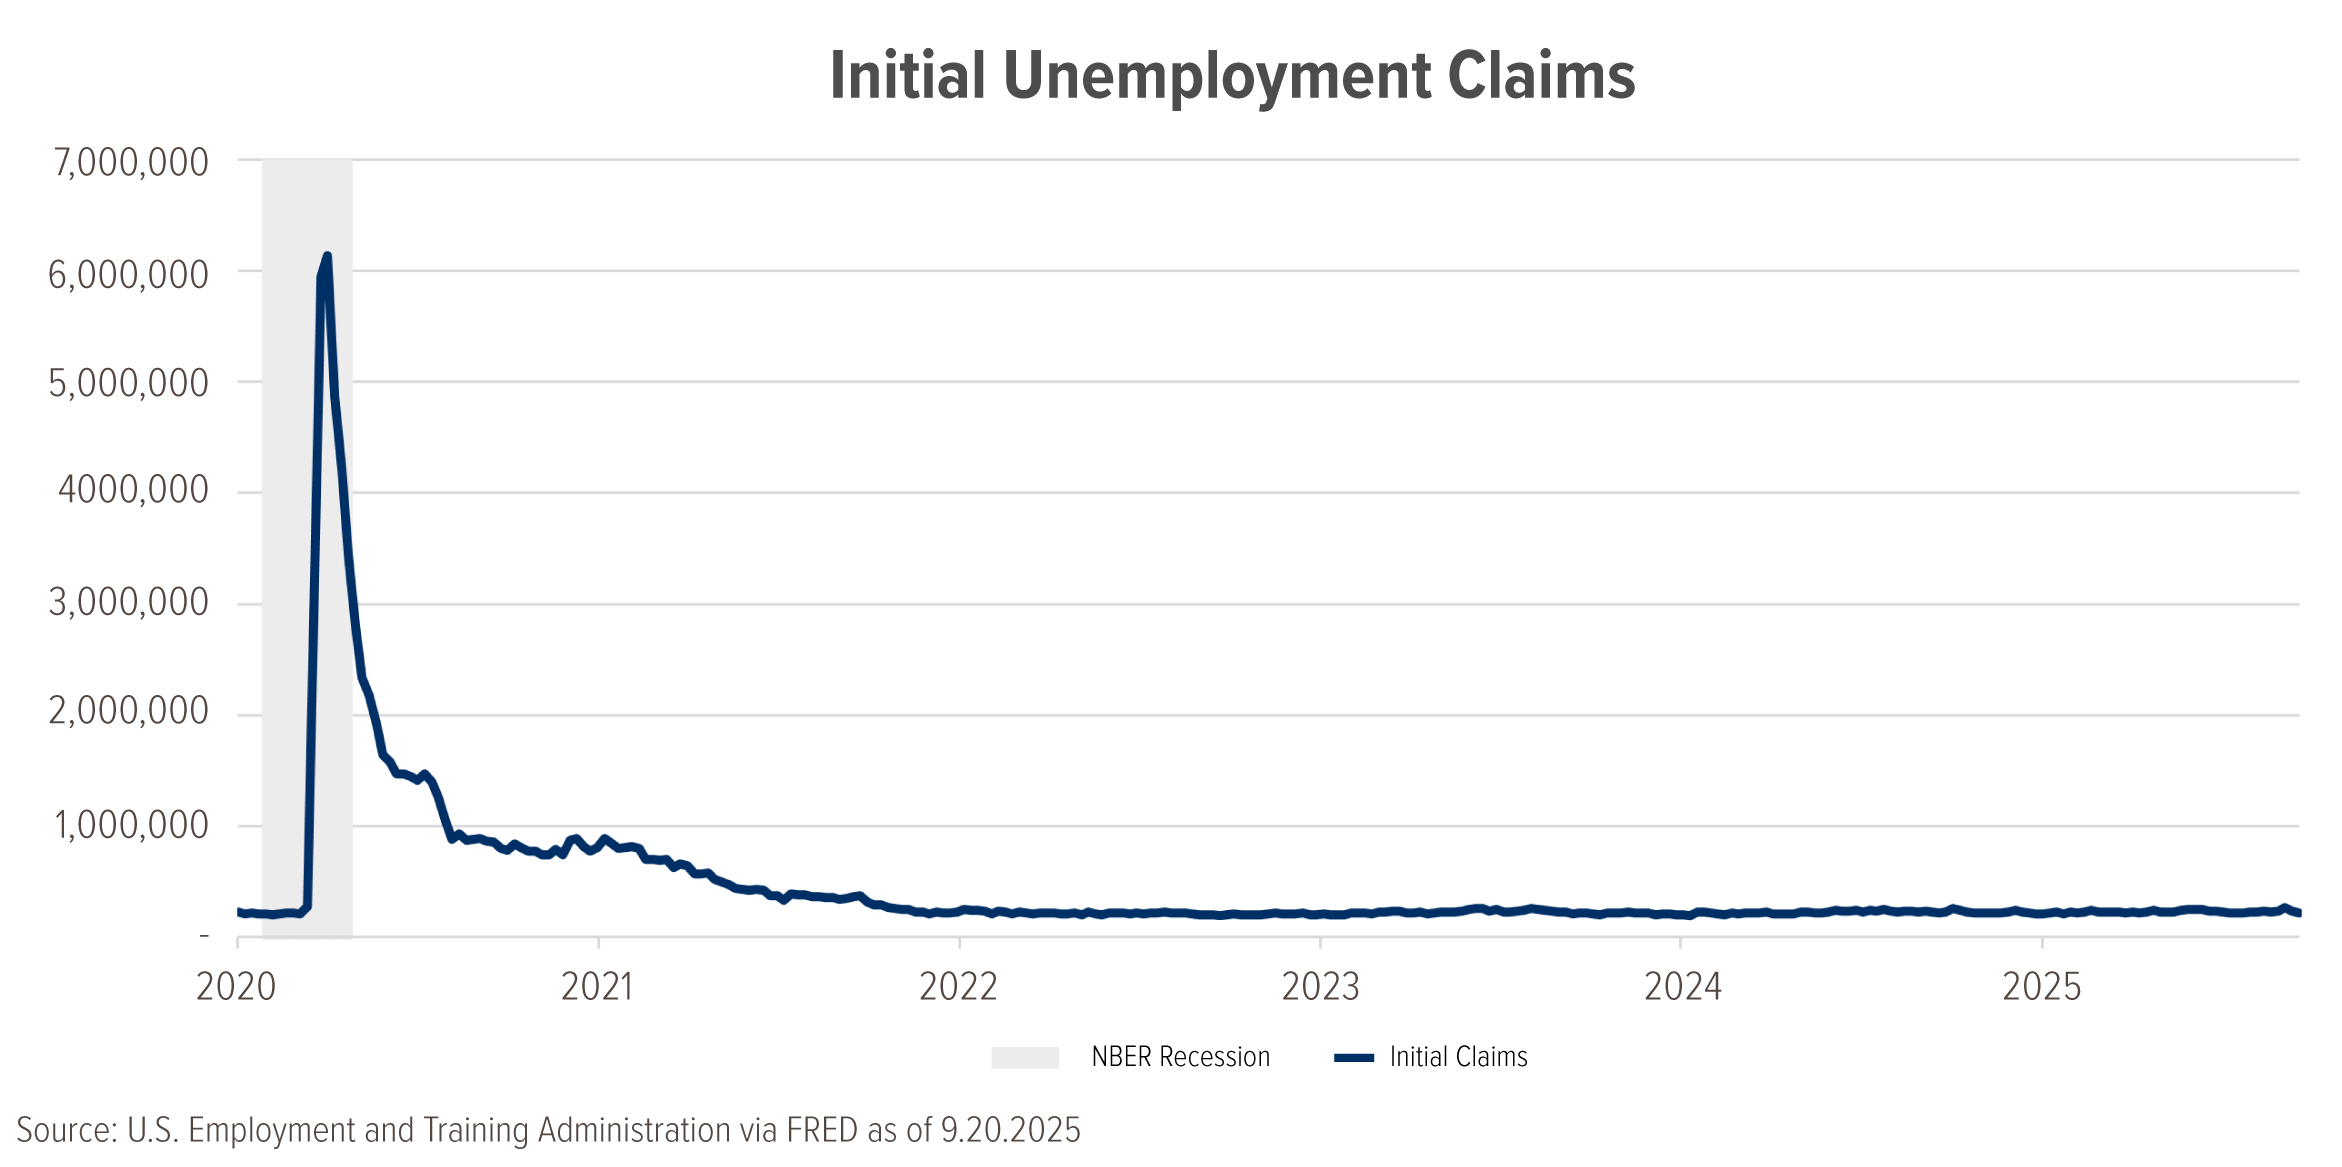
Conversely, initial jobless claims, which measure the number of people filing for unemployment benefits for the first time, is considered a leading economic indicator and something we pay attention to. Because the data is reported weekly, this provides an almost real-time indicator of labor market stress or resilience. The chart on the following page shows a 5-year lookback of initial claims, with the starting point just prior to COVID. The most recent data, as of September 20, showed 218,000 people filing initial unemployment claims, which is among the lowest readings going back to 1967 when the data was first compiled.
In the current environment, low initial claims but a slowly rising unemployment rate may indicate rising churn and slower hiring (which current economic data suggests), but overall job losses remain limited. Given the tariff uncertainty that set in post- Liberation Day, it's not surprising labor markets are adjusting to changing policy initiatives. However, overall economic conditions remain favorable, consumer spending remains resilient, accelerating AI capex is a tailwind, and a positive fiscal impact from the income and tax initiatives in the Big Beautiful Bill seems plausible heading into 2026.
Bond Volatility Collapse
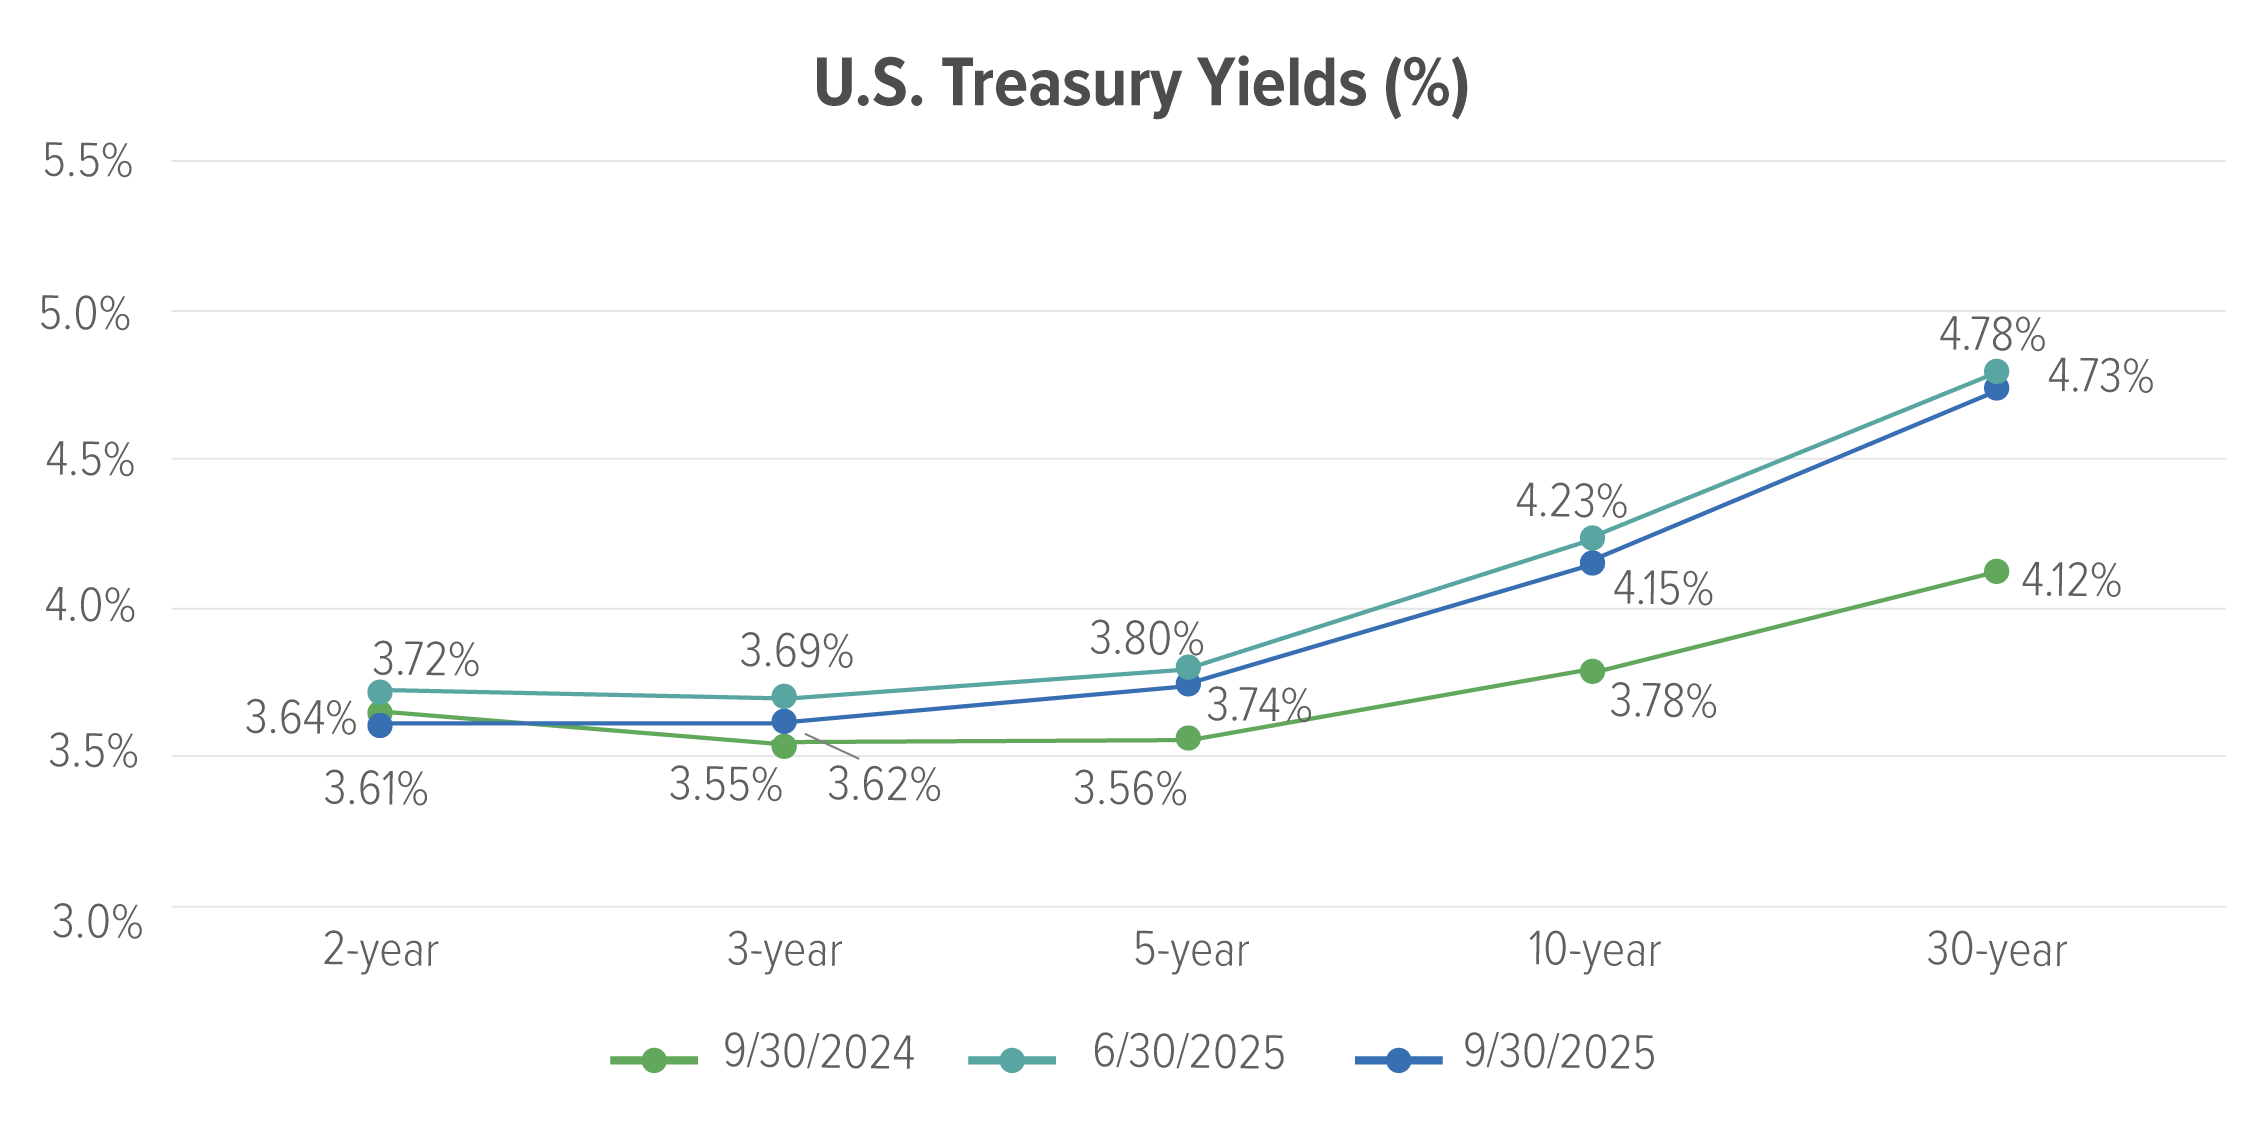
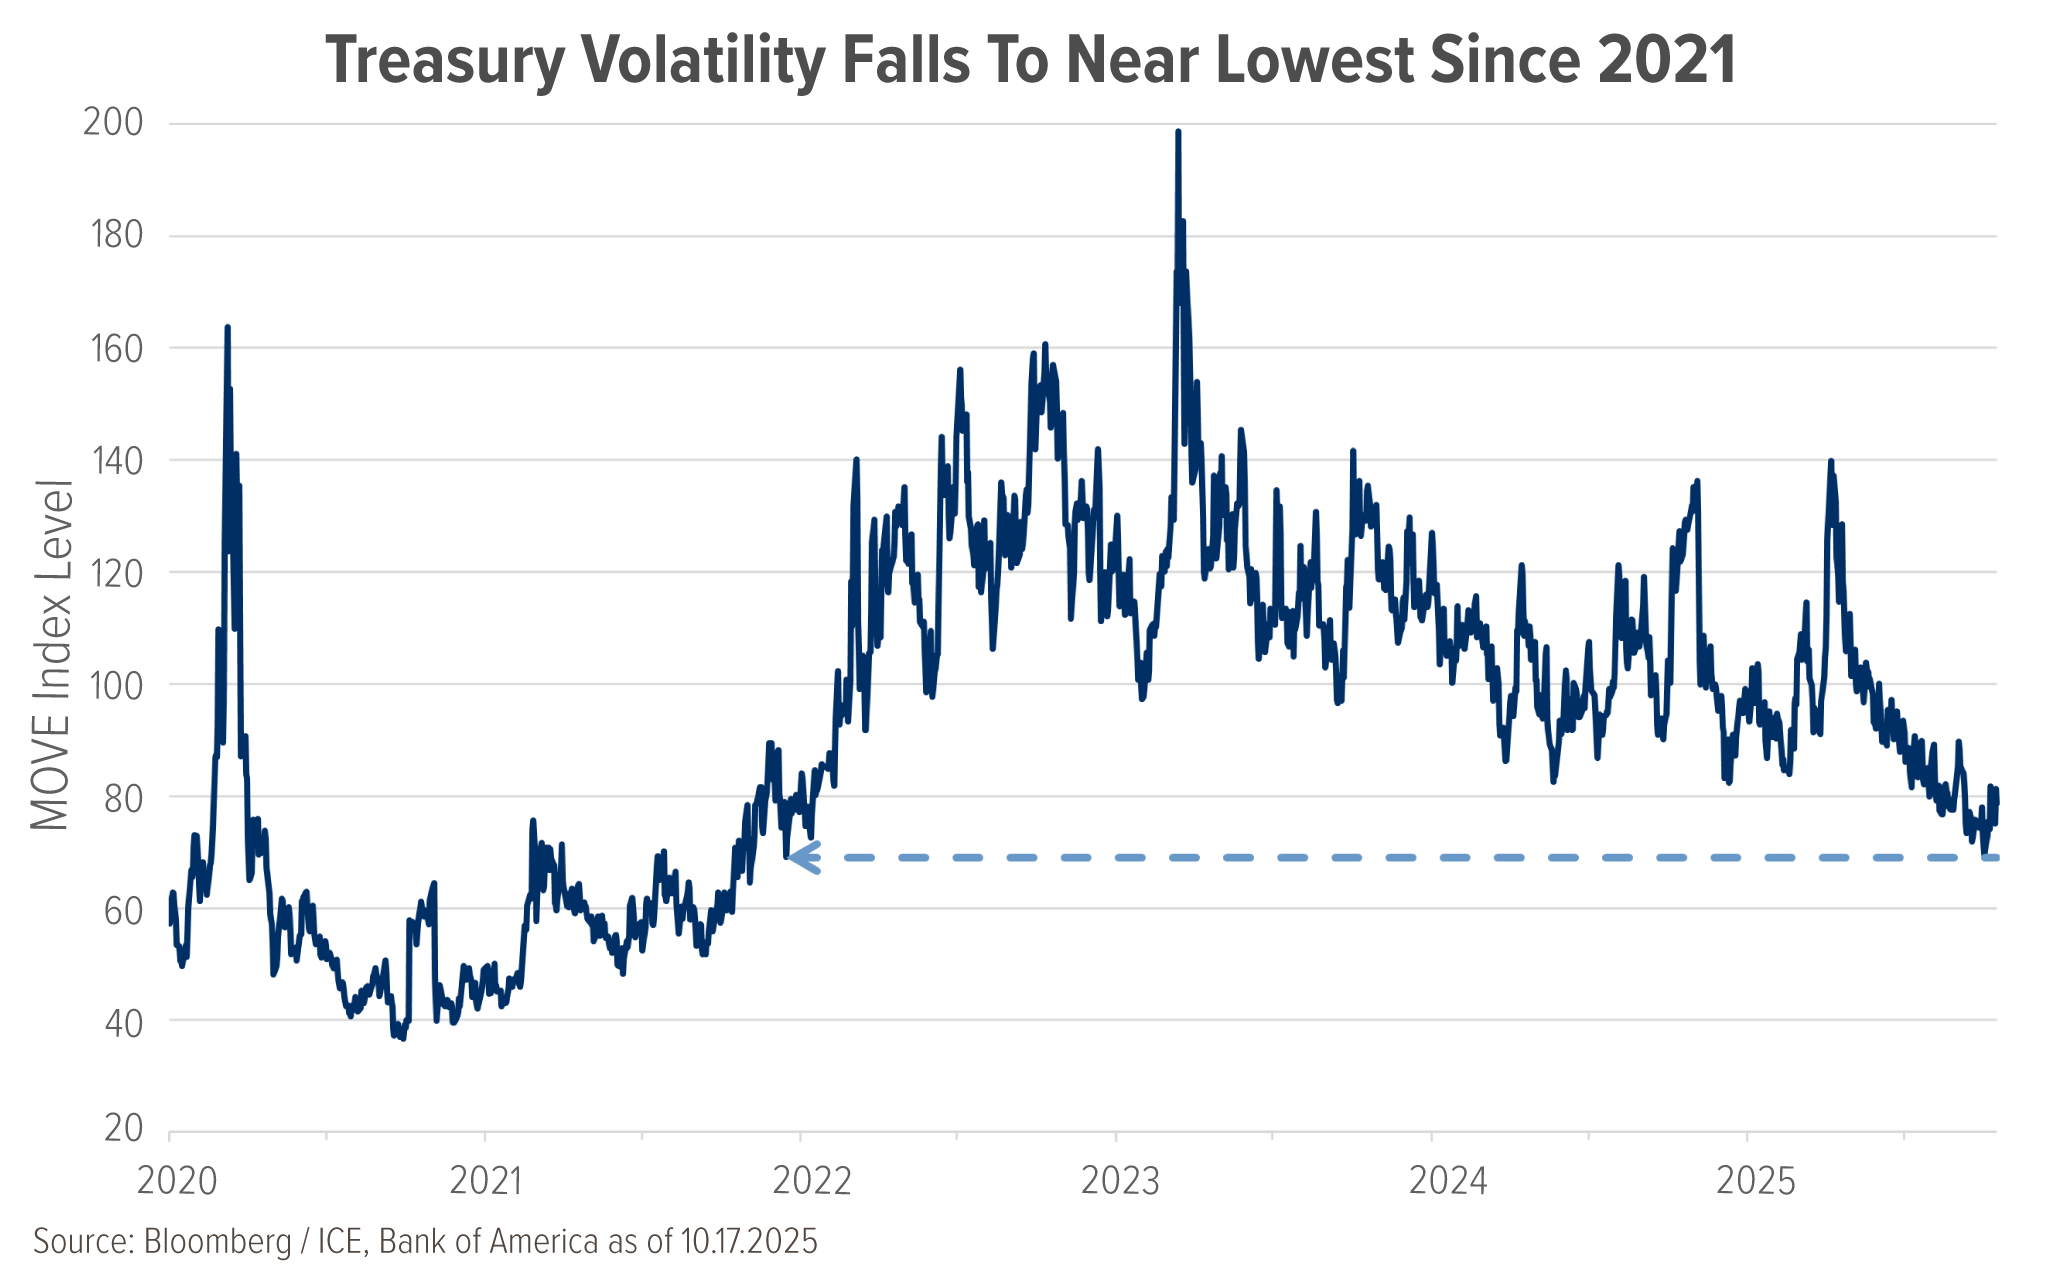
In terms of rates, it was a relatively uneventful quarter despite all the headlines surrounding Fed independence, the gold rally, and ongoing U.S. government deficit fears. As illustrated below, U.S. Treasury yields suggest that interest rates didn't move much in Q3, resulting in the MOVE index (see the Treasury Volatility Chart below) falling near the lowest level since 2021. Not only has the MOVE index fallen in half since the liberation day peak, but every consecutive high has been replaced, and every low has been followed by further declines.
A low MOVE index suggests market participants don't expect significant near-term movement in yields. But expected or implied volatility is not the same as directional certainty. Low-interest rate volatility implied by the MOVE index may signal a “locked in” Federal Reserve rate path, with a series of incremental 25 bps cuts priced in over the year, or more cynically, simply too much investor complacency.
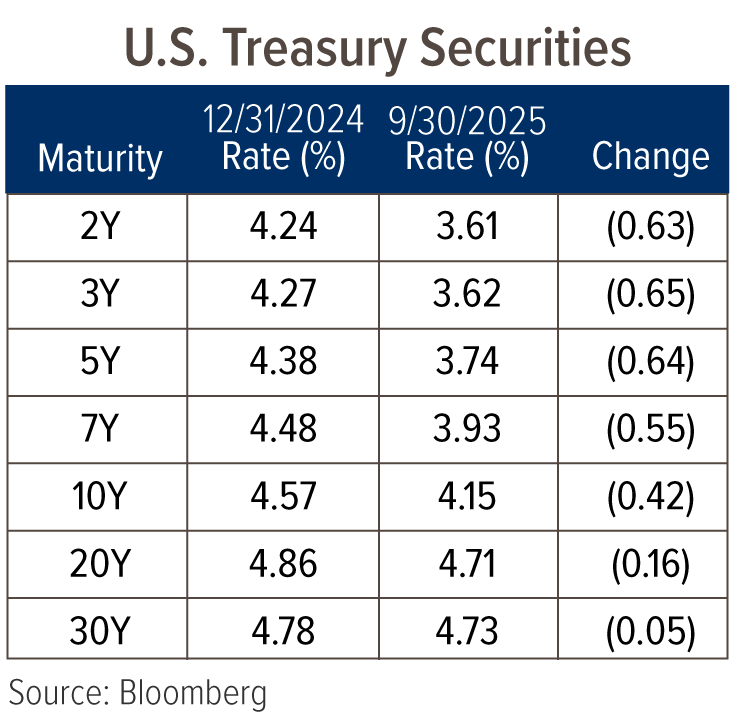
As we enter the fourth quarter, interest rates have continued to shift lower across the curve except for the long end. The chart below zooms in on the year-to-date declines across maturities, with the most significant decline shown in 2- and 5-year maturities, which are most sensitive to Fed policy. Should the job market weaken further, evidenced by a significant rise in initial jobless claims, the long end of the curve could see a more pronounced drop in yields given the resilience they've shown so far this year.
Spreadcession
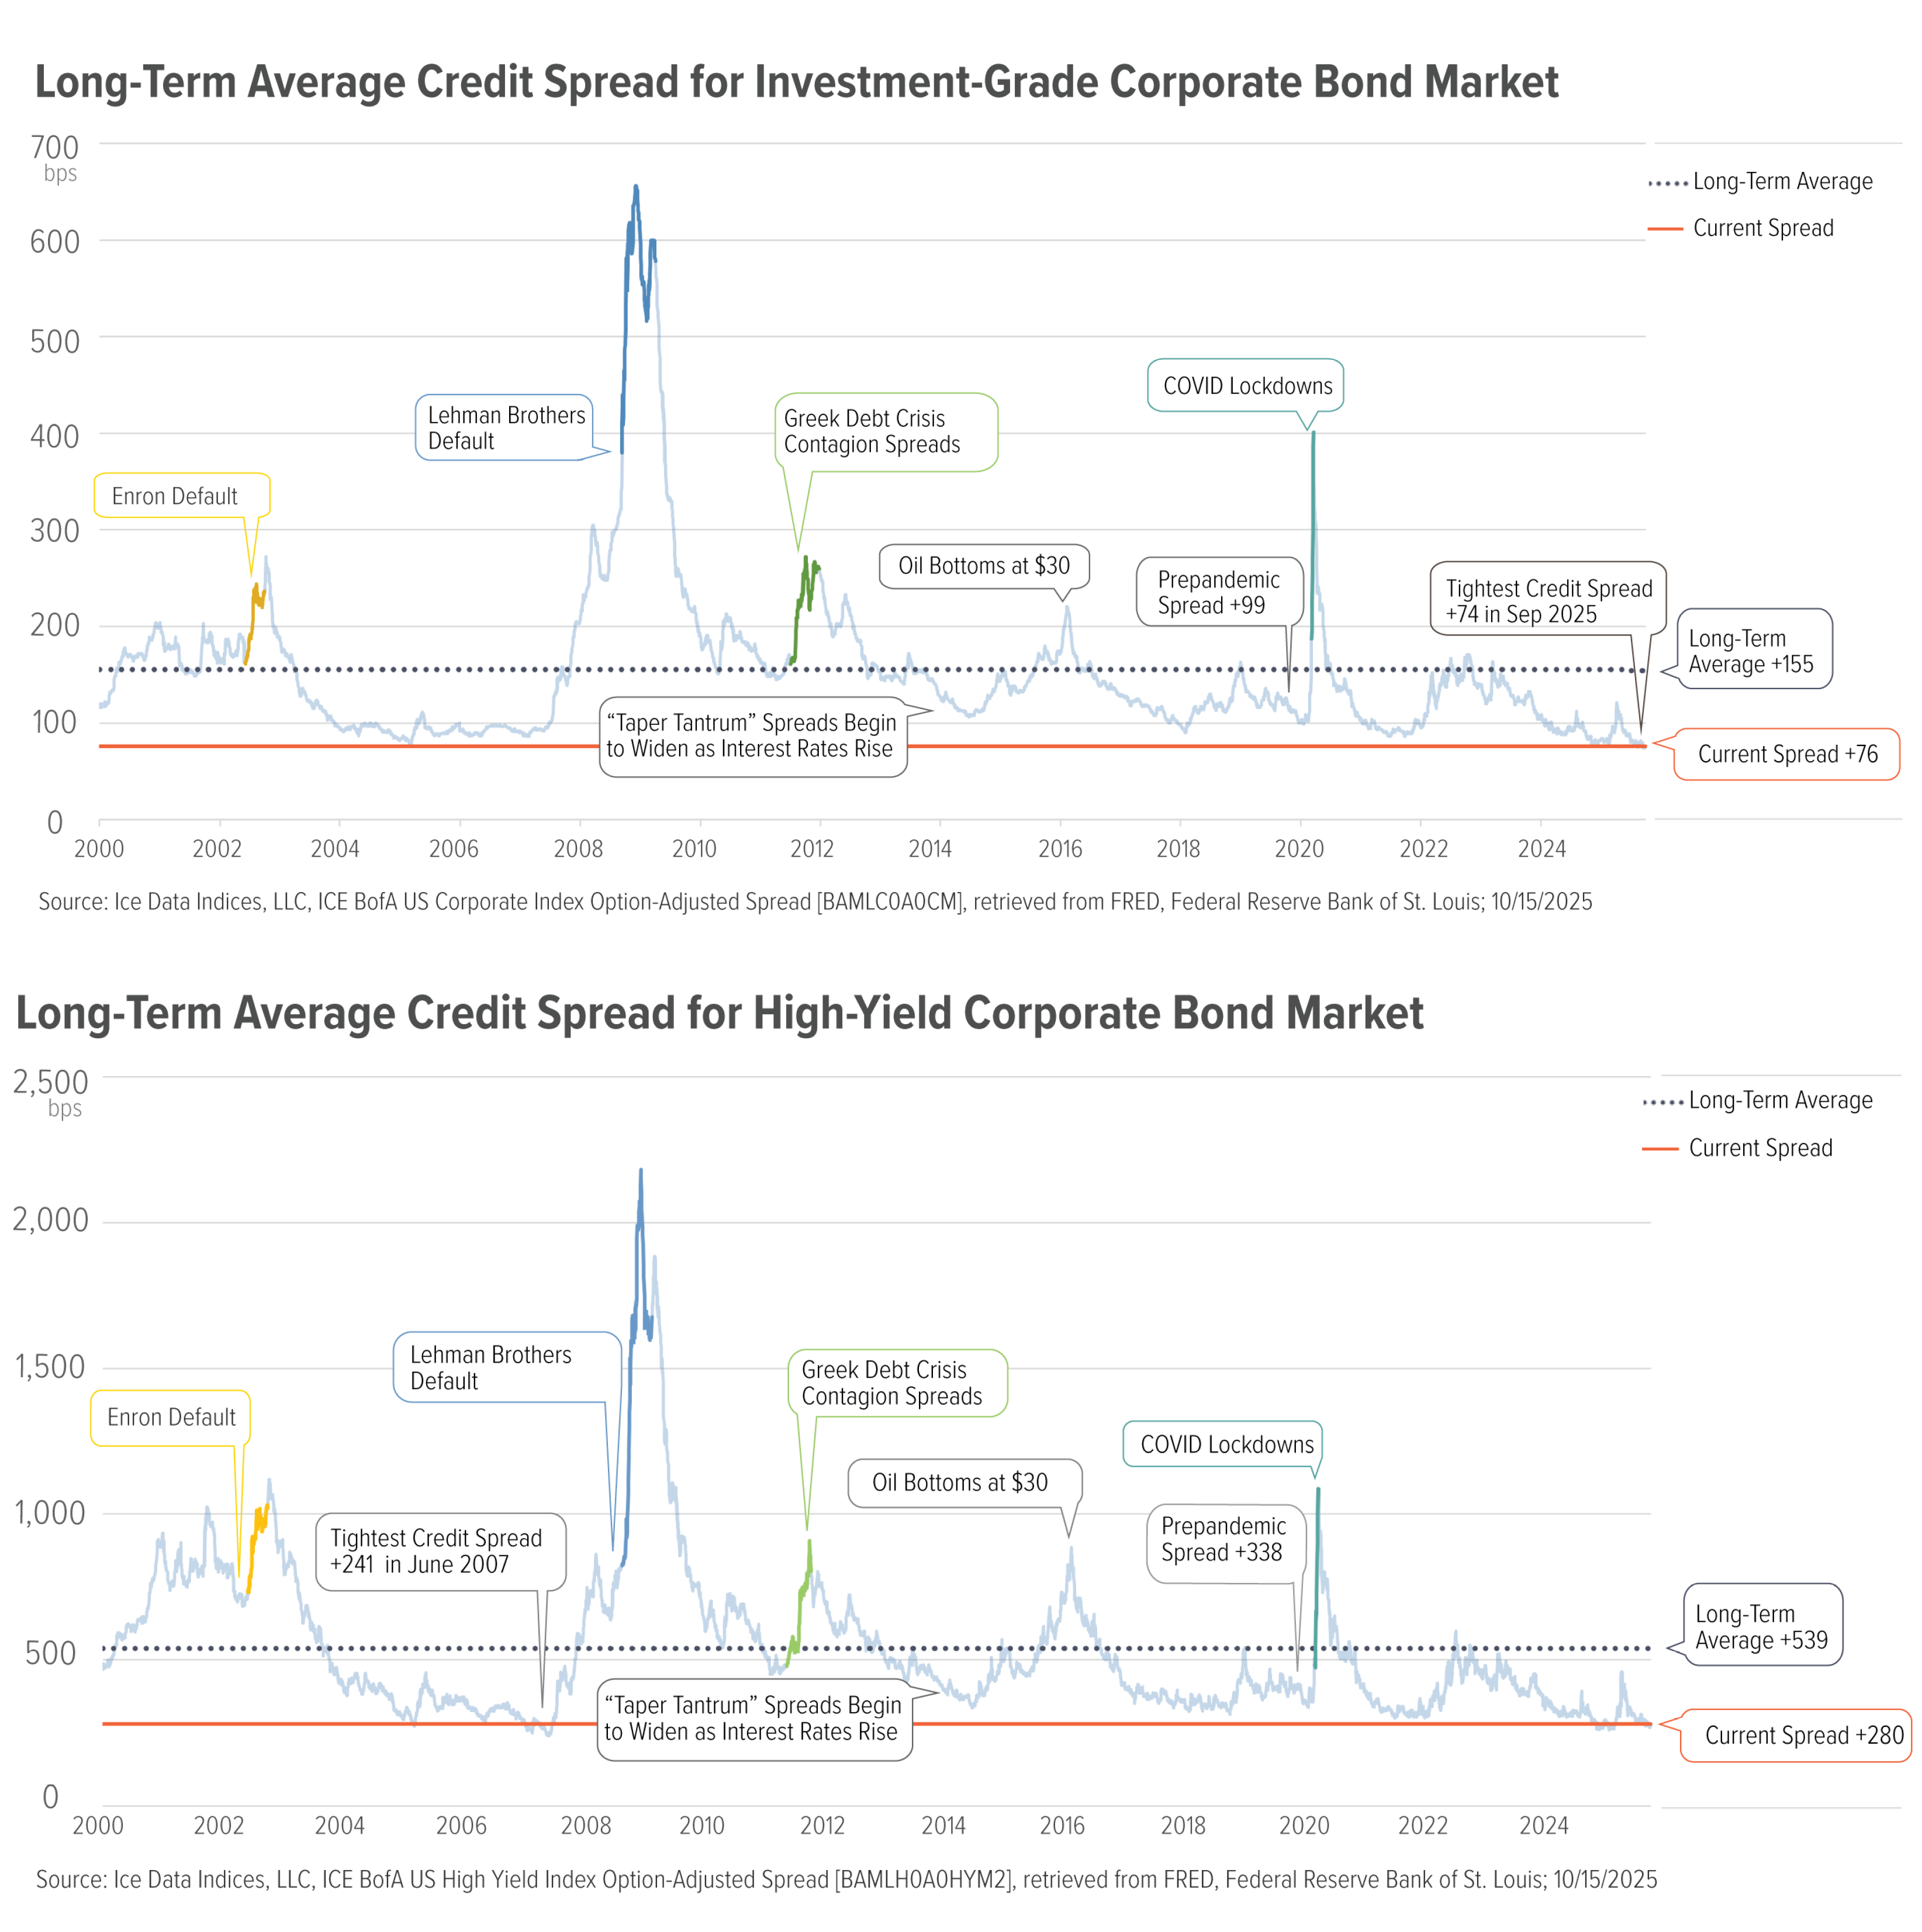
To borrow from a recent report from Wells Fargo Analyst Finian O'Shea, regardless of the flavor, public or private, credit markets of all stripes are facing a Spreadcession, when spreads move to historically tight levels and our view of risk-adjusted returns are unattractive. Corporate credit spreads, along with their securitized brethren, continued to retrace the Liberation Day spread widening. Perception or not, Goldilocks, combined with very strong market technicals (i.e., demand > supply), has resulted in ideal conditions for borrowers to push on spread, collateral quality, structure and documentation requirements.
While select opportunities remain, investors must be aware of and alert to shifting market conditions. We have scaled back and may pause investing in certain market segments based on these factors. We hope this proactive risk management approach will pay off over the long term. As illustrated in the charts below, both the investment grade and high yield corporate bond markets are traversing the tightest spread band going back to 2000.
Outlook
Risk premiums across financial markets are pricing little room for error. For now, both fundamental and technical factors are supportive of keeping spreads tight. However, it's not where you start that necessarily matters most in a marathon, but how you navigate the long journey that leads to the finish line. From today's spread levels, we are comfortable not setting the pace with a portfolio full of credit risk, instead focused on remaining patient and hydrated with a high-quality portfolio, and plenty of liquidity to use when the conditions become more turbulent and are more suited for pushing the pace.
/sitefiles/live/documents/literature-and-publications/FI_Insights/3Q25_FII_FromTariffstoTranquility.pdf
The opinions expressed are those of Weitz Investment Management and are not meant as investment advice or to predict or project the future performance of any investment product. The opinions are current through 10/16/2025, are subject to change at any time based on market and other current conditions, and no forecasts can be guaranteed. This commentary is being provided as a general source of information and is not intended as a recommendation to purchase, sell, or hold any specific security or to engage in any investment strategy. Investment decisions should always be made based on an investor's specific objectives, financial needs, risk tolerance and time horizon.
Basis Points (bps) refers to a unit of measurement that is equal to 1/100th of 1%, or 0.01%.